Category: Business Tips

  • Restaurant Table Turnover Rate Optimization Strategies

    Restaurant Table Turnover Rate Optimization Strategies

    When I ran shift operations in a busy 80-seat bistro, our team spent months believing that faster turns required pushing guests out the door. We were wrong. Rushing diners kills check averages, destroys hospitality, and ruins gratuities. True restaurant table turnover rate optimization strategies focus on eliminating administrative latency—the dead time spent waiting for orders, checks, and resets.

    By restructuring our service sequence to target unforced operational delays, we shaved twelve minutes off our average ticket time. That single shift transformed our bottom line without a single guest feeling hurried.

    The Economics of Eliminating Friction Over Speed
    The Economics of Eliminating Friction Over Speed

    Table turnover measures how many distinct parties occupy a single table over a meal period. When tables sit idle between guests or diners wait endlessly for payment terminals, your floor bleeds margin.

    Turnover Rate = Shift Length (Minutes) / Average Turn Time (Minutes)

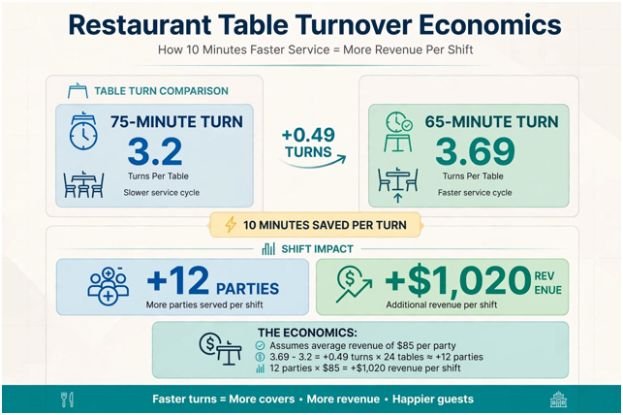
    If you operate a 4-hour dinner shift (240 minutes) with an average dining duration of 75 minutes, each table yields 3.2 turns. Reducing that duration to 65 minutes increases your yield to 3.69 turns. That small fraction translates to serious money when applied across a full dining room.

    Metric Baseline (75-Minute Turns) Optimized (65-Minute Turns) Operational Gain
    Turns Per Table 3.20 3.69 +0.49 turns
    Parties (25 Tables) 80 parties 92 parties +12 parties / shift
    Shift Revenue ($85 Avg Check) $6,800 $7,820 +$1,020 / shift
    Annual Delta (6 Shifts/Week) $2,121,600 $2,439,840 +$318,240 / year

    These gains work in tandem with long-term strategies to lower operating costs in restaurant business to dramatically widen operational profit margins.

    Auditing the Meal Lifecycle for Dead Time
    Auditing the Meal Lifecycle for Dead Time

    Every meal consists of dining time (eating, conversing, relaxing) and dead time (waiting). Research published by the Cornell Center for Hospitality Research highlights that guest satisfaction correlates with pacing consistency rather than raw speed.

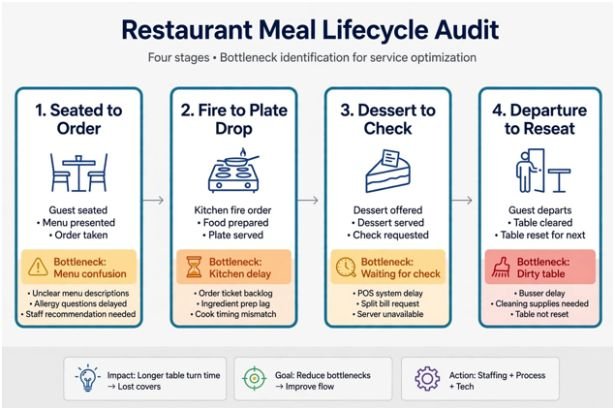
    I audit four service stages to isolate hidden waste:

    Service Stage Common Bottleneck Corrective Operational Action
    Seated to Order Analysis paralysis over sprawling menus Train servers to deliver beverage service and take orders within 90 seconds.
    Fire to Plate Drop Kitchen line imbalances during peak hours Balance line-cook ticket distribution with standardized prep routines.
    Dessert to Check Waiting for dropped bill, pickup, card swipe Settle payments tableside instantly via digital terminals.
    Departure to Reseat Dirty tables lingering unattended Assign dedicated busser runners during peak reservation waves.

    Front-of-House Workflows That Protect Hospitality

    Front-of-House Workflows That Protect Hospitality

    Floor efficiency relies on clear guardrails. Without defined standards, servers default to disorganized habits that bottleneck the dining room.

    Complete Parties and Continuous Pre-Busing

    Never seat partial parties during high-demand rushes. One guest waiting 25 minutes for friends occupies a table that could complete half a dining cycle. Establish a polite, firm check-in protocol at the host stand to stage parties near the bar until everyone arrives.

    Simultaneously, enforce systematic pre-busing. Servers must clear dirty plates, discarded glassware, and wrappers continuously throughout the meal. By the time a dessert fork drops, the table should hold only water glasses and the check presenter. This practice cuts bussing and sanitization time from five minutes down to ninety seconds.

    Maintaining these demanding workflows requires adequate floor coverage. Review our fair workweek compliance checklist to schedule support staff predictably without incurring costly overtime penalties.

    Floor Architecture and Menu Engineering

    A dining room’s physical setup dictates how fast it operates. If your servers weave through crowded choke points to grab clean forks, you lose valuable minutes on every turn.

    Dynamic 2-Top Seating Over Rigid Layouts

    Industry data from the National Restaurant Association shows that party sizes of two make up the largest dining demographic in casual and upscale-casual concepts. Yet many dining rooms rely on fixed four-top tables.

    Table Configuration Seating Efficiency Capacity Utilization Impact on Flow
    Fixed 4-Top Booths Low for 2-person parties 50% seat loss per couple Restricts flexibility during evening rushes
    Modular 2-Tops High across all party sizes 90–95% optimal seating Easily pushed together or separated on demand
    Communal Seating Very High 95%+ high-density seating Ideal for walk-ins, solo diners, and fast turnaround

    Splitting rigid booths into modular two-top tables lets your hosts assemble custom layouts on the fly. You instantly eliminate the dead capacity of two guests occupying a four-top.

    Pair your floor design with a focused, engineered menu. Large menus overwhelm guests and slow the kitchen. Cutting your menu by 20% simplifies line prep, speeds customer decisions, and eliminates slow-moving inventory.

    Tech Integrations That Shave Minutes

    Mobile hardware and automated booking platforms remove administrative steps from service. A study by Deloitte Consumer Hospitality Insights found that restaurants utilizing modern digital ordering and payment tools reduced table occupancy duration by up to 30%.

    Equipping front-of-house teams with handheld terminals, as highlighted in the Toast Restaurant Technology Report, allows servers to send drink orders directly to the service bar while standing at the table. Food items fire to the kitchen line immediately, bypassing the wait at stationary terminal banks. Most importantly, servers close out tabs at the table in thirty seconds.

    Stop Rushing Diners and Start Orchestrating Flow

    Maximizing your turnover rate is about managing floor logistics, not forcing guests to eat faster. When you strip out administrative lag—the bill-dropping dance, slow resets, and sprawling menus—diners enjoy an attentive, seamless meal. Your kitchen stays in rhythm, your servers handle higher volumes with less stress, and your floor generates predictable revenue every single shift.

    Start by auditing your payment collection process this weekend; cutting that single bottleneck yields the fastest return in hospitality.

    Frequently Asked Questions

    1. What is a good table turnover rate for a restaurant?

    Casual restaurants typically target 3 to 4 turns per shift, while fine-dining establishments average 1.5 to 2 turns.

    2. How do you calculate table turnover rate?

    Divide the total number of seated parties during a shift by the total number of available tables.

    3. Will turning tables faster hurt guest tips?

    No, eliminating payment delays and service gaps improves guest satisfaction while allowing staff to serve more total parties.

    4. How do I move lingering guests without being rude?

    Politely invite them to the bar and offer a complimentary after-dinner drink to free up high-demand tables.

  • Fair Workweek Compliance Checklist for Multi Unit Businesses

    Fair Workweek Compliance Checklist for Multi Unit Businesses

    Managing hourly schedules across dozens or hundreds of store locations will quickly expose every gap in your labor operations. If you operate retail, hospitality, or quick-service footprints across regulated regions, a standardized fair workweek compliance checklist for multi unit businesses is the only reliable shield against six-figure statutory penalties.

    Having managed corporate labor planning across conflicting municipal borders, I have seen regional managers inadvertently trigger cascading predictability premiums simply by sending two baristas home thirty minutes early. 

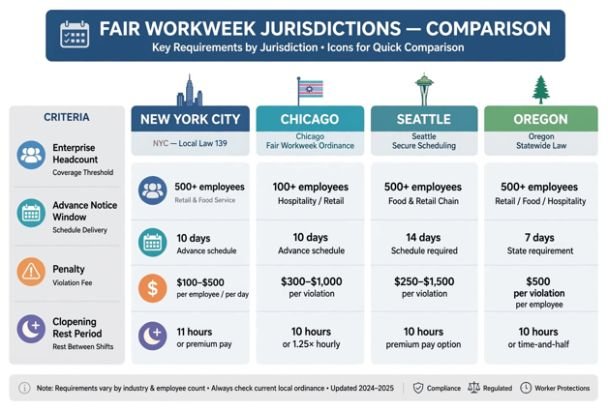
    Fair Workweek laws—often called predictive scheduling mandates—vary significantly across jurisdictions like New York City, Chicago, Seattle, and the state of Oregon. When scaling across county and state lines, multi-unit operators cannot rely on store managers memorizing shifting statutory deadlines. Compliance must be built directly into enterprise software rules and store routines.

    Navigating Cross-Jurisdictional Scheduling Across Multi-Unit Portfolios

    A major hazard for multi-unit operators is enterprise aggregation. In cities like Chicago and Seattle, whether your store must comply does not depend on that unit’s headcount alone. Regulators aggregate your global enterprise headcount. 

    A suburban store with nine workers often falls under full city mandates if your corporate entity employs 100 or more people globally.

    Before deploying staff, verify the exact regulatory parameters governing each address in your fleet.

    Jurisdiction Enterprise Headcount Threshold Advance Notice Window Penalty for Employer Cuts Rest Period Between Shifts (“Clopening”)
    New York City 30+ Fast Food units globally; 20+ Retail workers in NYC 14 days (Fast Food) / 72 hours (Retail) Up to $75 per shift cancelled/cut 11 hours minimum; $100 premium if waived
    Chicago 100+ employees globally (50+ in Chicago) 14 days 50% regular rate for unworked hours cancelled within 24 hours 10 hours minimum; 1.25× regular rate if waived
    Seattle 500+ employees globally 14 days 50% pay for hours cut or cancelled 10 hours minimum; 1.5× regular rate if waived
    Oregon (Statewide) 500+ employees globally 14 days 50% pay for unworked hours cancelled/shortened 10 hours minimum; 1.5× regular rate if waived

    For operators managing tight margins, implementing systematic labor compliance serves as one of the most dependable strategies to lower operating costs, eliminating non-productive penalty spending at the store level.

    The Core Fair Workweek Compliance Checklist

    The Core Fair Workweek Compliance Checklist

    Deploy this operational checklist systematically across your workforce management (WFM) tech stack and field management routines.

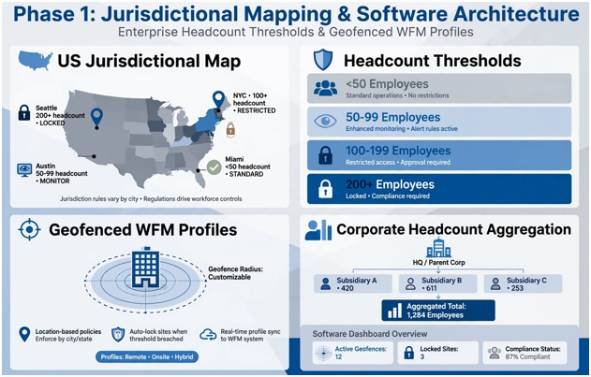
    Phase 1: Jurisdictional Mapping and Software Architecture

    Phase 1: Jurisdictional Mapping and Software Architecture

    • Audit global headcount thresholds: Verify corporate entity counts against municipal standards outlined by agencies like the Chicago Department of Business Affairs and Consumer Protection.
    • Implement geofenced WFM profiles: Lock store scheduling software to local municipal profiles so a manager in Manhattan cannot accidentally use upstate New York rules.
    • Enforce dynamic system warnings: Configure your scheduling engine to alert managers when shift adjustments encroach upon statutory notice windows.

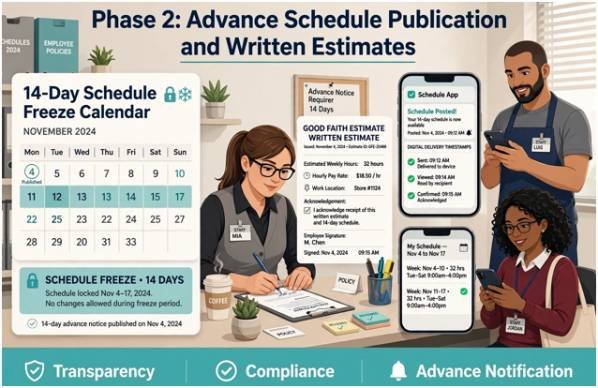
    Phase 2: Advance Schedule Publication and Written Estimates

    Phase 2: Advance Schedule Publication and Written Estimates

    • Issue Good Faith Estimates (GFE): Provide every new hire with a signed, written estimate of expected weekly hours and typical shift days prior to onboarding.
    • Enforce the 14-day schedule freeze: Finalize and post rosters at least 14 days before the cycle begins (or 72 hours for NYC retail) via physical posting and mobile apps.
    • Log digital delivery timestamps: Maintain electronic delivery receipts proving employees received unhindered access to schedules before the statutory deadline.

    Phase 3: Penalty Avoidance and Predictability Pay Automation

    • Lock automated premium payroll codes: Ensure unexpected shift additions, extensions, or cancellations trigger automated predictability pay on wage stubs without manual manager discretion.
    • Capture written employee consent: Never assign added shifts or short-notice changes verbally; collect digital, timestamped opt-in signatures inside your scheduling portal beforehand.
    • Block unsanctioned “clopenings”: Enforce mandatory 10- to 11-hour rest intervals between shifts, requiring automatic premium wage multipliers if a worker voluntarily waives this rest.

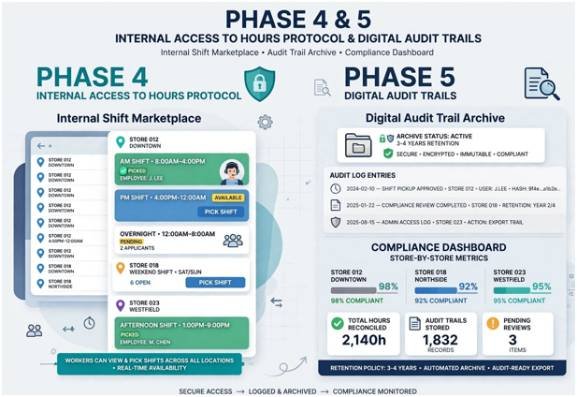
    Phase 4: Internal Access to Hours Protocol

    • Enforce internal-first shift distributions: Review standards from the Seattle Office of Labor Standards and offer newly available shifts to qualified, existing part-time staff before hiring external candidates.
    • Observe statutory internal posting durations: Keep open shifts posted on internal communication channels for the full required window (typically 48 to 72 hours) before opening external listings.
    • Establish multi-store shift pooling: Enable cross-unit workers to pick up nearby hours while configuring software guardrails to prevent unintended overtime triggers.

    Phase 5: Digital Audit Trails and Statutory Recordkeeping

    Phase 5: Digital Audit Trails and Statutory Recordkeeping

    • Archive all schedule variants: Save original draft notices, published versions, and timestamped revisions for at least three to four years in accordance with rules from the Oregon Bureau of Labor and Industries (BOLI) and NYC DCWP.
    • Track employee-initiated swaps separately: Verify that voluntary peer shift trades are flagged as exempt from employer predictability pay penalties.
    • Run automated store compliance dashboards: Monitor store-by-store predictability pay volumes weekly to identify rogue scheduling practices before city auditors intervene.

    Operational Best Practices for Store-Level Execution

    The most common point of operational breakdown occurs between store managers and shift workers. When unexpected absences force a general manager to scramble, they often pressure available workers or grant preferred shifts unevenly. If inconsistent scheduling practices create friction on shift, learning to handle peer conflict among frontline workers quickly restores team stability without triggering schedule alterations that violate local laws.

    Treat your store managers as operators needing rails rather than compliance experts. Restrict a store manager’s ability to edit shifts inside the 14-day window without an approval workflow from your HR or operations director. This simple operational boundary eliminates 90% of predictability pay liabilities within the first month.

    Frequently Asked Questions About Fair Workweek Compliance

    1. Does an employer owe predictability pay if an employee calls out sick?

    No, predictability pay is generally waived if a schedule change occurs because an employee cannot work due to illness, voluntary absence, or mutual peer trade.

    2. Can an hourly employee voluntarily waive their advance notice window?

    An employee may voluntarily agree to accept short-notice shifts, but the employer must still pay applicable statutory predictability pay premiums unless explicitly exempt under local ordinance rules.

    3. How long must multi-unit companies retain scheduling records?

    Most jurisdictions mandate retaining all schedule drafts, timecards, written estimates, and written consents for a minimum of three years.

    4. What happens when an employee agrees to work a clopening?

    The worker must provide explicit written consent, and the employer must pay the required local wage premium for all hours worked inside the rest window.

    Clocking Out: Turning Compliance From a Liability Into Retention

    Fair Workweek laws are often viewed purely as corporate hurdles, but treating them as an operational discipline actually lowers your store turnover. Frontline teams leave when chaotic schedules destabilize their personal lives. 

    By combining clear Good Faith Estimates with automated shift-filling workflows, you protect your enterprise from statutory fines while building an hourly roster that stays. 

    Audit your store scheduling logs this week, identify where manual manager overrides happen most, and lock down your digital guardrails before the next posting cycle.

  • How to Handle Peer Conflict Among Frontline Workers

    How to Handle Peer Conflict Among Frontline Workers

    Frontline friction is rarely personal; it is operational. When two nurses, retail associates, or line cooks clash during a lunch rush, telling them to “communicate better” solves nothing. Knowing how to handle peer conflict among frontline workers requires recognizing that high-stress shifts trigger physiological threat responses that derail standard reasoning.

    Over a decade running operations in fast-paced retail and healthcare settings taught me that workplace hostility stems from friction in the physical workflow. If you want to stop peer flare-ups, you have to fix the environment that creates them.

    The Root Drivers of Frontline Team Friction

    Frontline employees do not operate behind soundproof office doors. They work shoulder-to-shoulder under bright fluorescent lights, persistent noise, and urgent customer demands. When conflict explodes, managers reflexively blame attitude. That diagnosis is usually wrong.

    Environmental Fatigue vs. Intentional Sabotage

    Environmental Fatigue vs. Intentional Sabotage

    Adrenaline spikes during peak service hours. Research documented by the Cornell ILR School confirms that high-strain job structures amplify interpersonal counterproductive work behaviors. 

    When a colleague seems short-tempered or uncooperative, they are often experiencing autonomic nervous system overload. A worker fighting sensory saturation cannot process nuance. Labeling an employee “toxic” when they are simply cognitively depleted ensures the conflict persists.

    Failed Shift Transitions

    The most explosive peer disputes happen at shift change. An incoming worker arrives to unstocked shelves, uncleaned stations, or unresolved customer issues left by the outgoing crew. 

    Resentment accumulates silently until a minor disagreement sparks a shouting match. Deploying an established standard operating procedures template for shift handovers eliminates ambiguous expectations and stops finger-pointing before it starts.

    A Step-by-Step De-escalation Framework for Shift Leaders

    Managing a peer fight on an active floor requires swift, physical intervention. The following protocol defuses active disputes without disrupting customer operations.

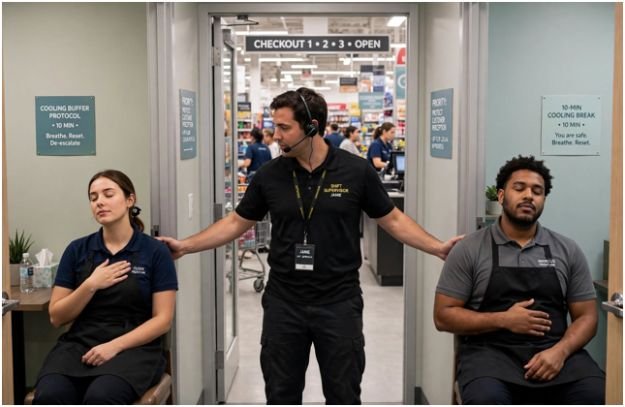
    Step 1: Enforce the 10-Minute Off-Floor Cooling Buffer

    Enforce the 10-Minute Off-Floor Cooling Buffer

    Never force workers to discuss an argument while their heart rates are elevated. Pull both parties off the floor immediately to protect customer perception and employee dignity. According to the Occupational Safety and Health Administration, untreated floor tension increases workplace violence risks and workplace injuries.

    Separate the individuals physically into distinct rooms or quiet spaces. Mandate a strict ten-minute silent buffer. Do not demand statements or apologies during this window. Let neurobiology do the work: adrenaline takes several minutes to metabolize back to baseline levels.

    Step 2: Separate Workflow Breakdowns from Personality Clashes

    Once breathing stabilizes, bring the workers together in a neutral room. Ban character attacks. Focus strictly on operational touchpoints. Shift the dialogue from subjective feelings to objective actions using this conversational script:

    Destructive Accusation Operational Reframe
    “You were lazy and dumped all the prep work on me.” “The station lacked sliced prep items when the 1:00 PM rush began.”
    “You ignored the registers and left me to drown.” “Register queues exceeded four customers while primary tasks ran parallel.”
    “You never communicate during the shift turnover.” “The handover log was missing notes on broken card terminals.”

    Step 3: Run the Structured SBAR Reset

    Step 3: Run the Structured SBAR Reset

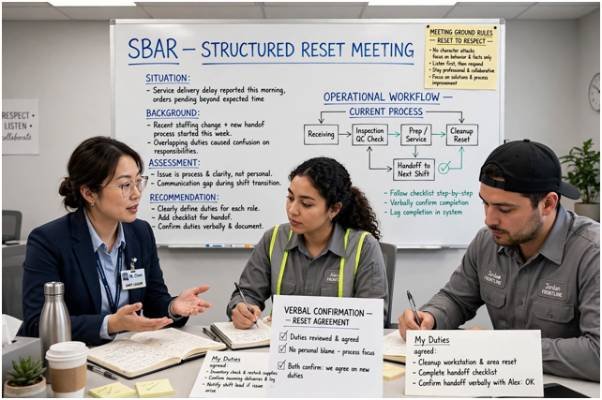
    Adapt the healthcare-derived SBAR (Situation, Background, Assessment, Recommendation) model to establish immediate working agreements. This framework strips emotional distortion out of conflict resolution.

    Situation: “We have an ongoing backlog at Station 2 during the 4:00 PM transition.”

    Background: “The morning crew is handling double the standard intake volume.”

    Assessment: “Station 2 needs an extra hand during the 30-minute changeover window.”

    Recommendation: “Worker A covers intake; Worker B clears the backlog until 4:30 PM.”

    Facilitate the agreement, write down the designated duties, and require both team members to verbally confirm their commitments.

    Peer Conflict Resolution Strategies Compared

    Intervention methods must match the severity and frequency of the dispute. The matrix below outlines how to evaluate and select the right response:

    Resolution Method Best Operational Fit Primary Limitation Escalation Trigger
    Peer-to-Peer Alignment Minor misunderstandings over task distribution. Requires both peers to possess baseline emotional regulation. Any personal insults or verbal attacks.
    Supervisor Mediation Chronic friction that degrades shift throughput. Consumes supervisor floor time during active shifts. Failure to meet written agreements.
    Formal HR Investigation Contractual breaches, wage disputes, harassment claims. Slow turnaround; does not resolve real-time floor friction. Violations cited by SHRM compliance standards.

    Institutionalizing Conflict Prevention on the Shift

    Institutionalizing Conflict Prevention on the Shift

    Reactive mediation wears leaders down. Preventing conflict requires building systems that make fair workloads transparent. Transparent scheduling tools, cross-training programs, and clear station rotations remove the perception of favoritism.

    When employees trust the schedule, peer friction drops drastically. Stable, predictable workflows also help organizations reduce absenteeism in shift work operations, as highlighted in operational studies published by the Harvard Business Review. When peer friction ceases to be a daily hazard, staff retention stabilizes.

    Frequently Asked Questions

    1. What causes most peer conflicts among frontline workers?

    Unclear task handovers, perceived workload imbalances, and cognitive exhaustion during peak operational hours cause most frontline disputes.

    2. How quickly should a supervisor intervene in floor conflict?

    Intervene immediately to pull workers off the floor, but enforce a 10-minute quiet buffer before mediating.

    3. Can peer conflict lead to frontline turnover?

    Yes; chronic peer friction creates an emotionally draining environment that drives voluntary turnover and unexcused shift absences.

    4. When must frontline conflict go straight to HR?

    Escalate immediately when disputes involve threats of violence, discrimination, sexual harassment, or legal safety violations.

    Stop Managing Drama, Start Engineering Workflows

    Interpersonal friction is rarely a character defect; it is an alarm showing where your operating system is leaking. Do not treat frontline teams like unruly children who need a lecture on politeness. Treat them like skilled operators caught in an engineered bottleneck. Remove the friction points in their daily environment, establish unambiguous handovers, and watch the workplace drama solve itself.

  • Strategies to Lower Operating Costs in Restaurant Business: A Floor-Tested Playbook

    Strategies to Lower Operating Costs in Restaurant Business: A Floor-Tested Playbook

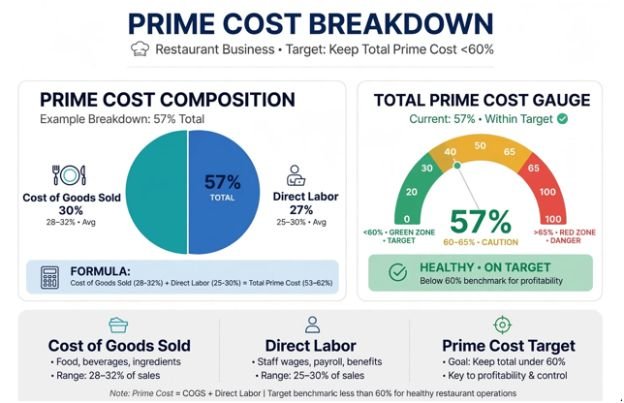
    Most restaurant owners panic during margin squeezes and cut napkins, buy cheaper trash bags, or demand staff turn off prep lights. I ran kitchens for fifteen years, and I watched operators bleed money while worrying about pennies. Real financial discipline lives in Prime Cost—the combined sum of your Cost of Goods Sold (COGS) and labor expenses.

    If you want effective strategies to lower operating costs in restaurant business environments, you must control this single combined metric. Prime Cost eats 55% to 65% of your total revenue. Pull those numbers down by even three percentage points, and you double your bottom line overnight.

    Tame Prime Cost Before Touching Minor Expenses

    Tame Prime Cost Before Touching Minor Expenses

    When food and labor drift beyond 60% of total sales, minor operational cuts cannot save your margins. I treat Prime Cost as an operational dashboard that exposes theft, over-portioning, and shift scheduling friction before they show up on an accountant’s end-of-month autopsy.

    Operational Lever Target Baseline High-Risk Threshold Corrective Focus
    Cost of Goods Sold (COGS) 28% – 32% > 35% Inventory cycle counts, recipe spec sheets
    Direct Floor & Kitchen Labor 25% – 30% > 33% SPLH schedule cuts, cross-station training
    Total Prime Cost Target < 60% > 65% Immediate vendor and menu engineering review

    According to benchmark research from the National Restaurant Association, restaurants operating with Prime Costs above 66% rarely sustain positive operating cash flow during seasonal dips.

    Pinpoint Leaks with Theoretical vs. Actual Food Cost

    Pinpoint Leaks with Theoretical vs. Actual Food Cost

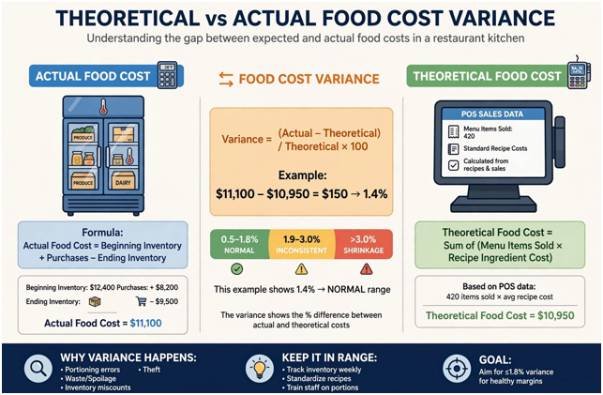
    Standard inventory arithmetic tells you what you spent:

    $$\text{Actual Food Cost} = \text{Beginning Inventory} + \text{Purchases} – \text{Ending Inventory}$$

    It fails to reveal what you should have spent. To catch operational waste, calculate your Theoretical Food Cost by multiplying individual recipe costs by total units sold in your POS.

    The gap between these two figures is your Food Cost Variance:

    $$\text{Food Cost Variance} = \text{Actual Food Cost} – \text{Theoretical Food Cost}$$

    In my kitchens, an operational variance between 1.0% and 1.8% represents standard trimming and moisture evaporation. 

    Once that variance clears 2.5%, raw ingredients are leaving the walk-in through over-portioning, unlogged prep spoilage, or outright theft.

    Variance Level Operational Diagnosis Floor Solution
    0.5% – 1.8% Normal kitchen trim & cooking loss Maintain standard line pars
    1.9% – 3.0% Inconsistent scoops, unmeasured pours Re-calibrate line scales and portion scoops
    > 3.0% Unrecorded prep loss or inventory shrinkage Lock walk-ins; run twice-weekly spot audits

    Lock Down Yields and Standardized Portioning

    Lock Down Yields and Standardized Portioning

    Line cooks often over-serve out of habit during a heavy service rush. An extra two ounces of skirt steak on a high-volume entree will quietly destroy margin percentages over a calendar quarter.

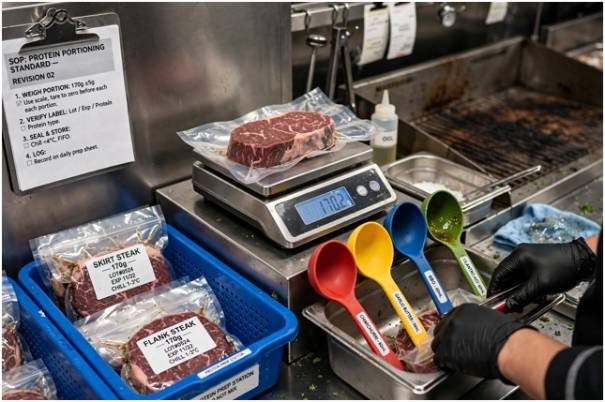
    Eliminate guesswork on the line with our documented standard operating procedures template. Install dedicated digital scales at your grill stations, mandate color-coded portion ladles for sauces, and require pre-portioned bags for bulk proteins.

    Eliminate Roster Bleed with Smarter Scheduling

    Labor expense is volatile because managers frequently schedule around personal habit rather than actual customer covers. The U.S. Bureau of Labor Statistics shows sustained wage growth across the service sector, meaning unplanned overtime directly devours your net profit.

    Schedule Shifts Against Sales Per Labor Hour (SPLH)

    Ditch static shift schedules. Track Sales Per Labor Hour (SPLH) in real time:

    $$\text{SPLH} = \frac{\text{Gross Hourly Sales}}{\text{Total Labor Hours Worked}}$$

    If your target SPLH for Tuesday lunch is $85 and floor receipts show $55 at 1:45 PM, shift managers must immediately cut prep runners and early dish shifts. 

    Stagger employee in-times across 15-minute intervals rather than bringing entire teams in at the top of the hour.

    Daypart Window Target SPLH Metric Common Operational Bleed Actionable Fix
    Lunch Rush (11:30–1:30) $90 – $110 Early prep idle time Stagger cook arrivals in 15-min intervals
    Afternoon Slump (2:00–4:30) $50 – $65 Floor staff waiting for tables Cut floor runners early; send preppers home
    Dinner Rush (5:30–9:00) $100 – $130 Unscheduled overtime spikes Cap pre-closing duties with strict shift caps

    Build Multi-Station Agility Across Shifts

    Specialized roles inflate your headcount. If your expediter cannot jump on the fry line, or your hosts cannot bus glassware during sudden rushes, you run an overstaffed floor.

    I use a structured cross training employees benefit matrix to track competencies across every station. Cross-training transforms front-of-house servers into back-of-house asset support during unexpected rushes, cutting overtime costs without sacrificing service speed.

    Re-engineer Menus Around High-Margin Overlaps

    Re-engineer Menus Around High-Margin Overlaps

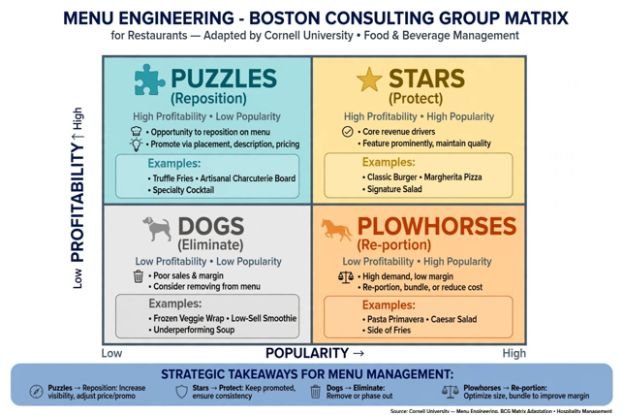
    Menu engineering is not graphic design; it is inventory control. Review your sales mix against ingredient carrying costs every quarter using the classic Boston Consulting Group matrix adapted by the Cornell Center for Hospitality Research:

    • Stars: High margin, high volume. Protect these recipes and standardize their production.
    • Plowhorses: Low margin, high volume. Re-cost these immediately by introducing smart fillers or adjusting protein portions.
    • Puzzles: High margin, low volume. Reposition them visually on your physical menu and train servers to highlight them.
    • Dogs: Low margin, low volume. Eliminate them immediately.

          HIGH PROFITABILITY

                  │

       Puzzles    │    Stars

     (Reposition) │  (Protect)

    ──────────────┼────────────── HIGH POPULARITY

        Dogs      │  Plowhorses

     (Eliminate)  │  (Re-portion)

                  │

            LOW PROFITABILITY

    Cross-utilize high-cost proteins across multiple entrees. If your prime ribeye only appears in one single specialty dish, any dip in guest orders results in expensive spoilage.

    Trim Overhead and Utility Baselines

    Kitchen equipment consumes massive amounts of energy under constant heat loads. Equipment data compiled by ENERGY STAR Commercial Food Service indicates regular maintenance cuts equipment energy consumption by up to 15%.

    Facility Area Maintenance Procedure Operating Cost Impact
    Refrigeration Units Clean condenser coils monthly Lowers compressor load and run-time power draw
    Walk-in Freezers Replace worn door gaskets and air strips Prevents cold-air loss and emergency service calls
    Dish Pit Operations Run cycles solely on full racks Drops hot water usage and chemical detergent spend

    Clean refrigerator coils every thirty days, change air filters on rooftop HVAC units quarterly, and fit low-flow pre-rinse spray valves in the dish pit. These operational adjustments deliver reliable savings without altering the guest experience.

    Frequently Asked Questions

    1. What is the fastest strategy to lower restaurant operating costs?

    Audit your weekly protein portions and immediately cut mid-afternoon staff shifts based on hourly sales volume.

    2. What should a healthy restaurant Prime Cost percentage be?

    Aim to keep total Prime Cost (food, beverage, and total labor) strictly between 55% and 60% of total revenue.

    3. How does food cost variance help manage inventory?

    It reveals the gap between what you spent and what your sales mix required, exposing internal waste, over-portioning, and theft.

    4. Can utility maintenance meaningfully lower restaurant overhead?

    Yes, routine coil cleaning, gasket replacements, and low-flow dish valves lower kitchen utility expenses by 10% to 15%.

    Drop the Pencils and Walk the Floor

    Spreadsheets show you where money went yesterday, but operational savings happen on the floor right now. 

    Pull your POS product mix, compare theoretical usage against physical walk-in counts, and give line cooks the portioning tools they need to succeed. 

    Real margin recovery begins the moment you treat every ounce of inventory as cash sitting on your shelves.

  • Standard Operating Procedures Template for Shift Handovers: The Floor Manager’s Guide

    Standard Operating Procedures Template for Shift Handovers: The Floor Manager’s Guide

    I spent a decade running round-the-clock shift crews across heavy manufacturing lines. Early in my career, our plant lost an entire production run because an outgoing operator forgot to mention a recalibrated sensor. The incoming technician assumed standard baseline parameters. By 4:00 AM, thousands of gallons of product spoiled.

    That incident proved that verbal promises fail under fatigue. Every operational facility needs a battle-tested standard operating procedures template for shift handovers to eliminate communication gaps, preserve asset uptime, and protect employee safety.

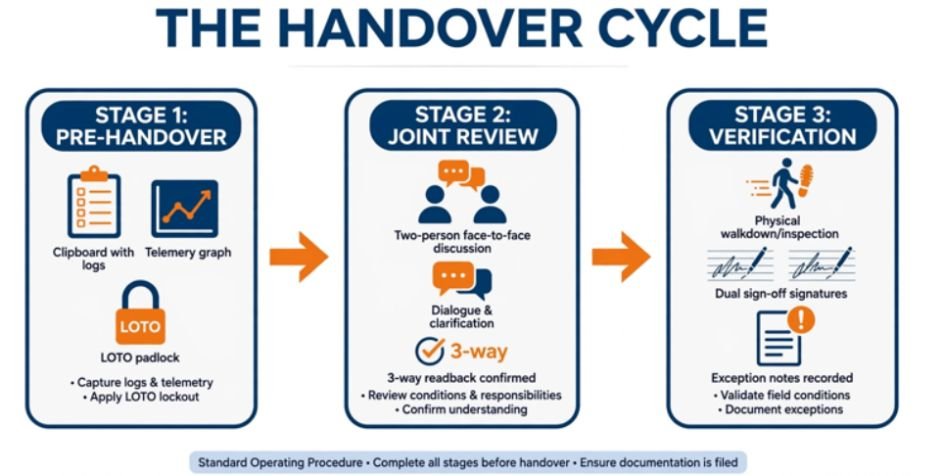
    The Handover Cycle 

    The Handover Cycle

                                  THE HANDOVER CYCLE

       ┌───────────────────┐      ┌───────────────────┐      ┌───────────────────┐

       │   PRE-HANDOVER    │      │   JOINT REVIEW    │      │   VERIFICATION    │

       │  Outgoing logs    │ ───> │  Face-to-face     │ ───> │  Physical walk,   │

       │  telemetry, LOTO, │      │  3-way readback   │      │  dual sign-off,   │

       │  and open permits │      │  of active alerts │      │  exception notes  │

       └───────────────────┘      └───────────────────┘      └───────────────────┘

    The Shift Handoff Trap: Why Most SOPs Fail on the Floor

    Most facilities treat handovers like casual water-cooler conversations. Team members exchange a two-minute verbal recap, punch their cards, and leave.

    According to regulatory analyses from the HSE UK Guidance on Shift Handover Communication, communication breakdown during shift handovers remains one of the primary root causes of major industrial accidents. When fatigue sets in at the end of a twelve-hour shift, working memory drops sharply. People forget crucial operational details.

    If your team struggles with unscheduled departures, learning how to reduce absenteeism in shift work operations helps stabilize crew rotations so staff have predictable turnover schedules.

    The 3-Way Communication Rule

    The 3-Way Communication Rule

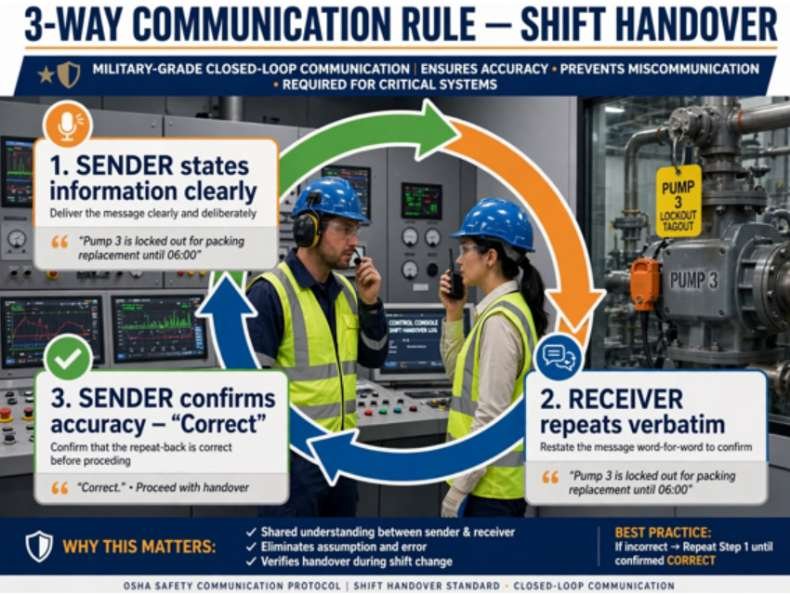
    To combat cognitive fatigue, adopt military-grade closed-loop communication:

    1. Sender states the information clearly (e.g., “Pump 3 is locked out for packing replacement until 06:00”).
    2. Receiver repeats the message verbatim (e.g., “Understood, Pump 3 is locked out for packing replacement until 06:00”).
    3. Sender confirms accuracy (“Correct”).

    NASA documents this exact protocol inside their NASA Human Systems Integration Guidelines to eliminate interpretation errors during critical system turnovers.

    The Master Standard Operating Procedures Template for Shift Handovers

    The Master Standard Operating Procedures Template for Shift Handovers

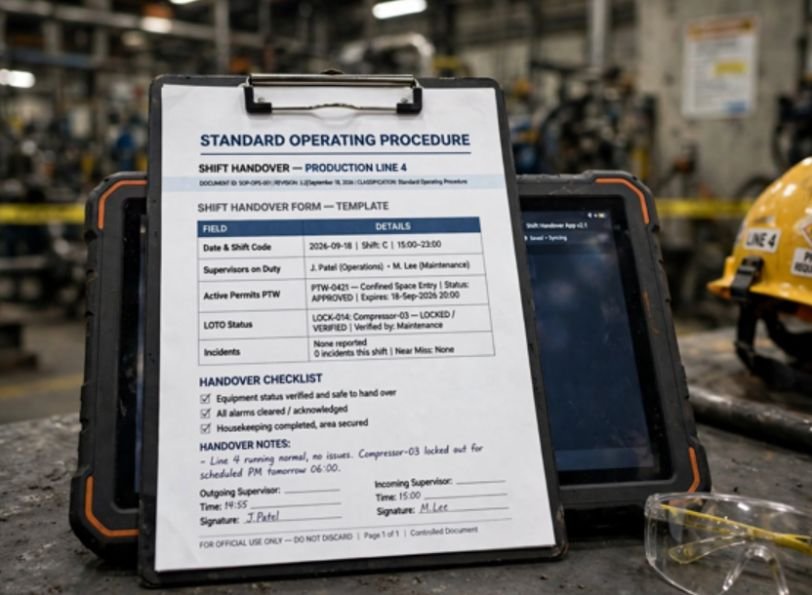
    Below is the exact production-ready standard operating procedures template for shift handovers that you can adapt directly for your management system.

    DOCUMENT ID: SOP-OPS-001

    REVISION: 3.2

    EFFECTIVE DATE: September 18, 2026

    CLASSIFICATION: Standard Operating Procedure (Shift Transitions)

    Section 1: Administrative Scope & Responsibility

    • Purpose: Establish a standardized, zero-defect process for transferring operational control between crews.
    • Scope: Applies to all rotational operators, technicians, control-room engineers, and supervisors across all operating assets.
    • Compliance Baseline: Aligns with OSHA Process Safety Management Guidelines for mechanical integrity and operating procedures.
    Role Core Handover Duty Primary Deliverable
    Outgoing Crew Pre-compile operational logs, clean workstations, document alarms. Completed Digital/Physical Handover Log
    Incoming Crew Arrive 15 minutes early, review logbook, conduct physical inspection. Formal Acceptance Sign-Off
    Shift Supervisor Audit log completeness, arbitrate contested equipment statuses. Shift Transfer Endorsement

    Section 2: Step-by-Step Transition Workflow

    1. Pre-Handover Logging (T-Minus 15 Minutes): The outgoing lead enters all throughput numbers, downtime logs, and pending maintenance orders. Operators ensure station cleanliness and restock consumables.
    2. Face-to-Face Joint Review (T-Minus 5 Minutes): Outgoing and incoming leads meet at the primary control desk. Both teams execute closed-loop reviews on running jobs and active permits. 
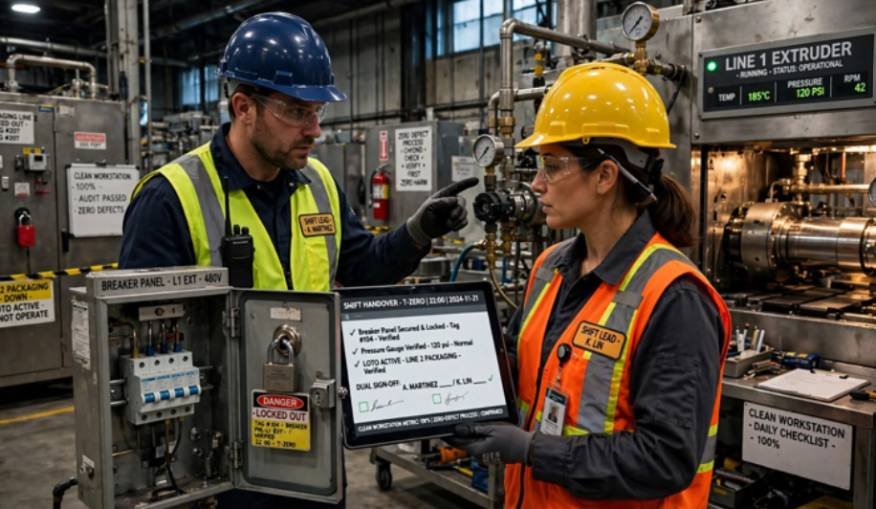
    3. Physical Asset Walk (Transition T-Zero): Both leads walk active operating lines together to visually confirm lockouts, pressure gauges, and physical equipment stops.
    4. Conditional Sign-Off: Both leads sign the log. If the incoming lead spots an unrecorded problem, they check “Accepted with Exceptions” and call the supervisor.

    If your facility operates cross-departmental lines, evaluate our cross training employees benefit matrix to verify whether incoming operators hold active certifications on complex equipment before accepting transfers.

    Shift Handover Logbook Reference Tables

    Print or configure these reference tables directly into your computerized maintenance management system (CMMS) or station clipboards.

    When handover information needs to be accessed away from a central desk, teams can also use how mobile productivity apps increase efficiency for field staff to keep critical updates, task details, and operational notes accessible during transitions.

    Part A & B: Identity, Safety, and Compliance Log

    Field Outgoing Record Incoming Verification
    Date & Shift Code 2026-09-18 | Shift A (Day) 2026-09-18 | Shift B (Night)
    Supervisors on Duty Marcus Vance (Lead) Sarah Lin (Lead)
    Active Permits (PTW) #PTW-8821 (Hot Work Line 2) Inspected & Confirmed Open
    LOTO Status Breaker 4B Padlocked (Tag #104) Physical Padlock Verified
    Incidents / Near Misses 1 Near Miss (Conveyor Jam, 14:20) Log Reviewed & Countersigned

    Part C & D: Live System Metrics and Action Item Tracker

    Asset / Line ID Operating State Current Output / Variance Immediate Action for Incoming Crew
    Line 1 – Extruder Running 1,420 units/hr (-3% target) Monitor bearing temperature on roller 4.
    Line 2 – Packaging Down (Scheduled) 0 units/hr (LOTO Active) Vendor tech arrives at 19:30 for belt splice.
    Line 3 – Assembly Running 980 units/hr (+2% target) Clean output bin before midnight run.

    Hard Truths from 15 Years of Rotational Shifts

    Hard Truths from 15 Years of Rotational Shifts

    Most handovers fail for psychological reasons rather than technical ones. Outgoing operators want to pack up and get home. Incoming operators need their first cup of coffee and dislike hearing bad news before starting their shift.
    Here are three rules I enforce on every floor:

    • Never allow solo handovers: Both the outgoing and incoming operators must be standing at the console simultaneously. No passing notes left on clipboards.
    • The “Clean Station” metric is not aesthetic: A messy workstation hides leaking seals, worn parts, and missing tools. Messy stations indicate chaotic handoffs.
    • Empower incoming teams to reject handovers: If an incoming operator discovers an unlogged mechanical fault or an undocumented Lockout/Tagout, they refuse the handoff until the shift supervisor signs off.

    Frequently Asked Questions

    1. What should be included in a shift handover template?

    A complete template requires administrative shift details, open safety permits (LOTO), system performance metrics, pending maintenance actions, and dual sign-off signatures.

    2. How long should an effective shift handover take?

    A proper handover takes 10 to 15 minutes, divided into solo preparation, joint face-to-face review, and a physical station walkthrough.

    3. Can shift handovers be conducted completely digitally?

    Yes, provided the digital platform requires manual field acknowledgments, captures time-stamped signatures, and occurs alongside a verbal conversation.

    4. What is the biggest risk of a poor shift handover?

    Undetected safety hazards like active energy sources or improperly isolated valves represent the most dangerous risk of an incomplete shift transition.

    Stop Running Blind: Your Next Shift Starts Now

    Shift turnovers mark the single most vulnerable moment in 24-hour operations. When you rely on informal handoffs, you gamble with production quotas and employee safety.

    Take this standard operating procedures template for shift handovers, paste it into your plant documentation, and run an unannounced audit on your next midnight transition. You might be surprised by what your teams leave unsaid.

  • Cross Training Employees Benefit Matrix for Small Business

    Cross Training Employees Benefit Matrix for Small Business

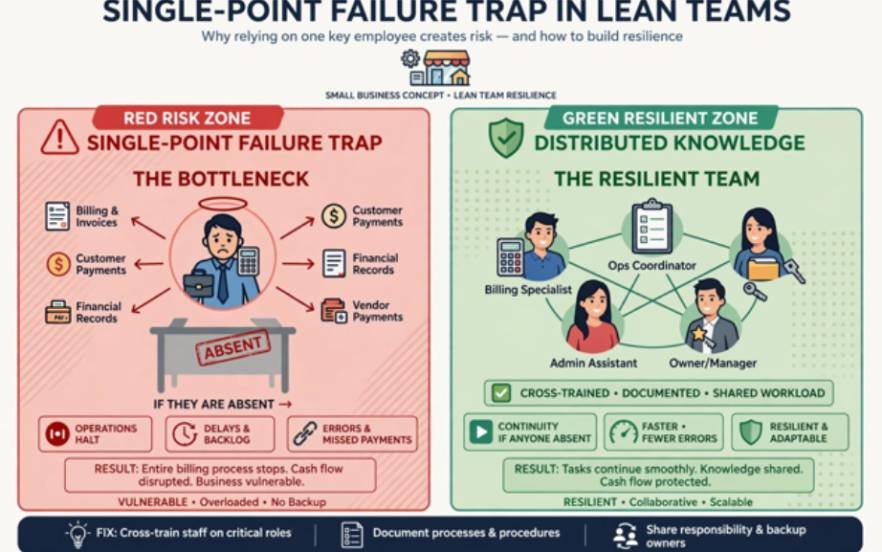
    A single key employee calling in sick can bring a lean enterprise to a complete halt. I learned this the hard way when our sole billing specialist took medical leave, stalling our accounts receivable for three straight weeks. Designing a cross training employees benefit matrix for small business operations became our survival mechanism. By mapping capabilities against operational vulnerabilities, small teams build resilience without inflating payroll costs.

    The Single-Point Failure Trap in Lean Teams

    The Single-Point Failure Trap in Lean Teams

    Running a business with five to twenty employees often creates accidental knowledge silos. When only one team member knows how to generate shipping labels or run client onboarding, that person becomes a structural bottleneck. Conducting an operational efficiency audit reveals these hidden vulnerabilities before an emergency forces your hand.

    According to workforce continuity research by the U.S. Small Business Administration, operational redundancies separate agile small firms from those that shutter during localized disruptions. Cross-training distributes specialized know-how across functional teams, converting fragile dependencies into interchangeable capabilities.

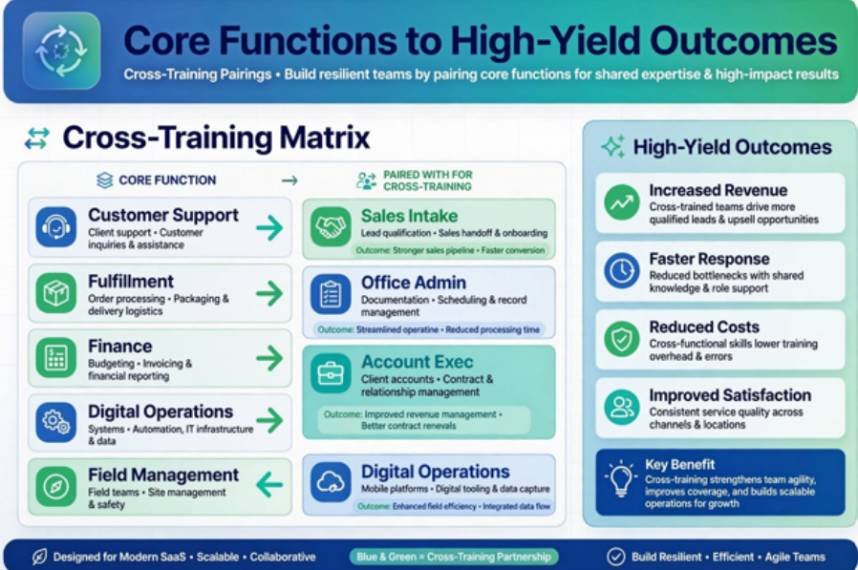
    Mapping Core Functions to High-Yield Outcomes

    Mapping Core Functions to High-Yield Outcomes

    Cross-training creates measurable business upside across daily operational tracks. The table below illustrates how pairing specific roles protects bottom-line continuity.

    Core Business Function Cross-Trained Role Pair Target Competency / Task Direct Business Benefit
    Customer Support Support Rep ➔ Sales Intake CRM lead qualification & logging Zero missed leads during call spikes
    Fulfillment Office Admin ➔ Shipping/Inventory Label generation & stock counts Order continuity during peak volume
    Finance & Admin Account Exec ➔ Invoicing Basics Creating invoices & Net-30 follow-up Steady cash flow during bookkeeper leave
    Digital Operations Social Lead ➔ Basic CMS Updates Content publishing & minor copy edits Eliminates costly agency retainers
    Field Management Shift Lead ➔ Payroll Verification Timecard audits & daily checklists Protects owner bandwidth for growth

    Cross-skilling frontline staff also helps reduce absenteeism in shift work operations by giving workers variety and coverage flexibility when emergencies arise.

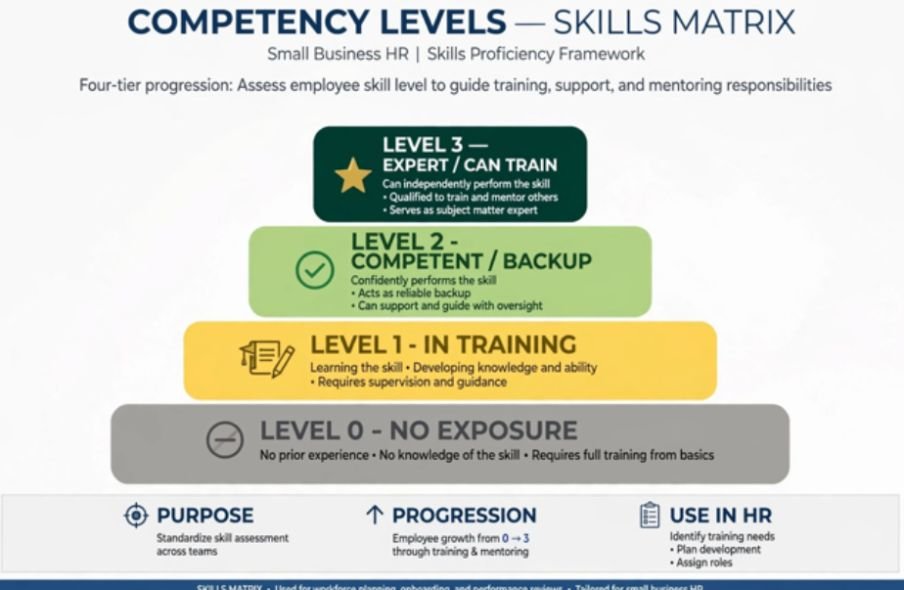
    The Strategic Skills Matrix: Levels 0 Through 3

    The Strategic Skills Matrix Levels 0 Through 3

    A benefit matrix works only when paired with an honest assessment of current staff capabilities. I use a four-tier tracking grid to monitor team coverage across mission-critical duties.

    Competency Levels:

    [Level 3: Expert / Can Train]  ➔  Fully autonomous; mentors others

    [Level 2: Competent Backup]    ➔  Executes reliably during absence

    [Level 1: In Training]         ➔  Understands basics; requires guidance

    [Level 0: No Exposure]         ➔  Unassigned; zero system access

    Data from the Society for Human Resource Management indicates that organizations mapping multi-role proficiencies experience significantly lower turnover. Tracking proficiencies visibly helps managers deploy talent strategically.

    Competency Tiers That Prevent Operational Chaos

    Evaluating employees using this framework highlights single-operator risks immediately.

    Employee Name Task A: Billing Run Task B: Site Maintenance Task C: Inventory Intake
    Marcus Vance Level 3 (Primary) Level 0 Level 2 (Backup)
    Elena Rostova Level 2 (Backup) Level 3 (Primary) Level 0
    David Chen Level 1 (Trainee) Level 0 Level 3 (Primary)

    If Marcus takes unexpected leave, Elena steps in seamlessly at Level 2 competency. Cash flow continues uninterrupted.

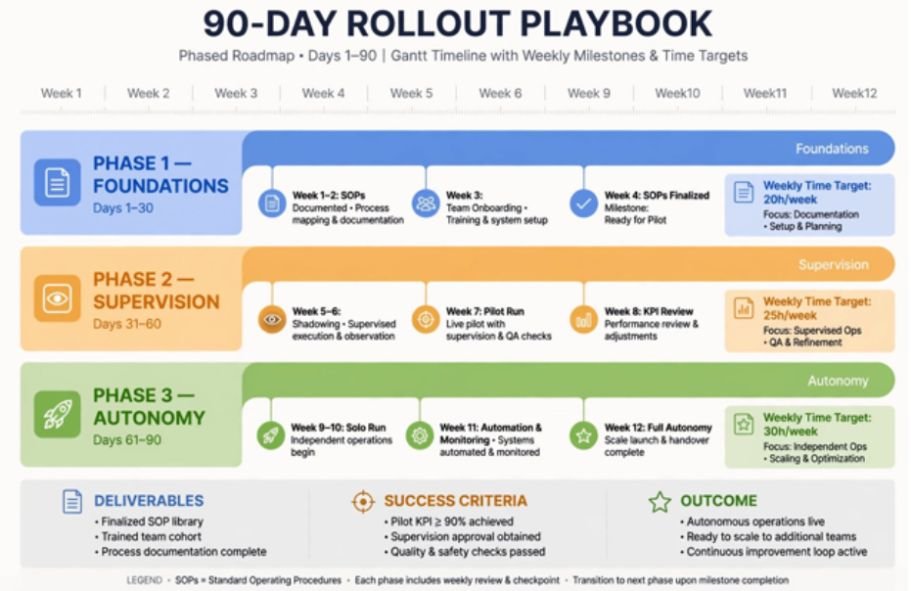
    The 90-Day Rollout Playbook for Lean Operations

    The 90-Day Rollout Playbook for Lean Operations

    Phase Window Weekly Time Target Tangible Milestone Output
    Phase 1: Foundations Days 1–30 1–2 hours / week Validated 1-page SOPs & 1-on-1 capacity buy-in
    Phase 2: Supervision Days 31–60 2–3 hours / week Completed shadowing & verified software logins
    Phase 3: Autonomy Days 61–90 1–2 hours / week First solo production run & maintenance cadence

    Rolling out cross-skilling without a phased schedule overwhelms daily operational capacity. I rely on a structured 90-day cycle to introduce new proficiencies gradually.

    Understanding the impact of predictable scheduling on overall workplace productivity can also help managers create consistent training windows without disrupting daily operations.

    Peer-reviewed analysis published in the Harvard Business Review highlights that cross-functional development improves retention when businesses provide designated learning windows during normal working hours.

    Mitigating Skill Dilution and Staff Resentment

    Cross-skilling initiatives fail when leadership ignores human factors. Two primary friction points require proactive mitigation:

    1. Compensation Friction: Workers often interpret cross-training as unpaid workload inflation. Anchor cross-training to professional growth paths, skill-tier bonuses, or merit reviews. Workplace research by Gallup links internal upskilling directly to increased employee engagement when paired with recognition.
    2. Skill Atrophy: A backup who handles a task once a year forgets the steps. Schedule recurring half-day rotations every month so backup operators maintain active operational memory.

    Frequently Asked Questions

    1. How does a skills matrix differ from a job description?

    A job description lists hiring requirements, whereas a skills matrix tracks dynamic real-time capabilities across a functioning team.

    2. How many backup operators should a small business train per task?

    Every mission-critical operational task requires at least one Level 2 backup operator alongside the primary owner.

    3. What is the best way to prevent employee burnout during cross-training?

    Cap weekly training hours at 10% of total working time and schedule sessions during historical low-volume periods.

    4. Can small businesses run cross-training without enterprise HR software?

    A cloud-hosted spreadsheet tracking standard Level 0 through Level 3 metrics provides sufficient functional visibility.

    Stop Running on Operational Thin Ice

    Building operational redundancy is not an expensive luxury reserved for large enterprises. Run a quick capability audit across your primary processes this week, pinpoint your solo dependencies, and assign your first Level 1 cross-training pair.

  • Operational Efficiency Audit Checklist for Retail Stores

    Operational Efficiency Audit Checklist for Retail Stores

    I spent fifteen years watching store managers run paper audits that changed nothing. They checked boxes, filed clipboards into filing cabinets, and watched shrinkage creep upward anyway. An operational efficiency audit checklist for retail stores must serve as an active diagnostic instrument, not an administrative chore. 

    If your current store audit does not uncover why your payroll leaks or why checkout queues stall, scrap it. Modern retail margins leave no room for vanity inspections.

    According to research by the National Retail Federation, inventory distortion and operational shrinkage continue to drain billions from brick-and-mortar balance sheets annually. Real store efficiency begins when your team diagnoses friction at the point of execution.

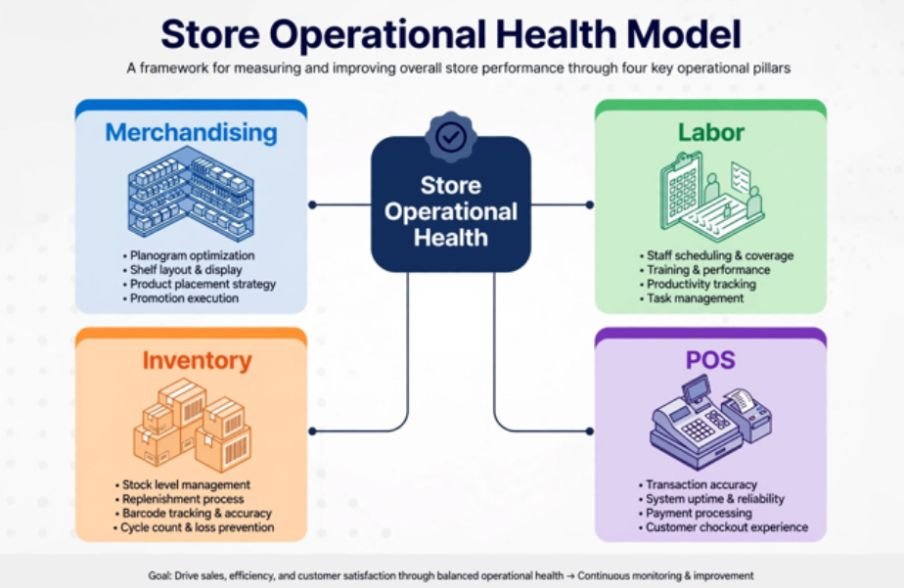
    Store Operational Health Model 

    Store Operational Health Model 

                             ┌────────────────────────────────┐

                              │   Store Operational Health     │

                              └───────────────┬────────────────┘

                                              │

              ┌────────────────┬──────────────┴───────────────┬────────────────┐

              │                │                              │                │

       [Merchandising]     [Labor]                       [Inventory]         [POS]

    • Planograms        • Traffic-to-labor match      • Cycle counts     • Queue time
    • Eye-level tags    • Cross-trained cashiers      • FIFO / RTV       • Hardware speed

    Storefront Visuals and Merchandising Execution

    Storefront Visuals and Merchandising Execution

    Your sales floor is either an engine of conversion or a maze of missed opportunities. Visual merchandising must do more than look pretty; it must funnel foot traffic directly toward high-velocity inventory.

    When conducting a floor audit, I inspect planogram compliance with a critical eye. Shelf misalignment creates phantom stockouts—inventory that exists in the system but remains invisible to the customer.

    Inspection Focus Standard Benchmark Friction Indicator
    Promotional Signage 100% current campaign alignment Expired sale tags still displayed on endcaps
    Eye-Level Stocking Top 20% velocity SKUs placed at 48″–60″ High-margin merchandise buried on bottom shelves
    Planogram Adherence ≥ 95% SKU position accuracy Arbitrary product substitutions made by floor staff
    Shelf Labeling Zero price mismatches against POS database Price discrepancy between shelf tag and terminal

    Audit digital and paper shelf tags against your point-of-sale pricing engine weekly. A single mismatched SKU damages customer trust and slows down terminal throughput during morning rushes.

    Labor Allocation and Shift Productivity

    Labor Allocation and Shift Productivity

    Labor represents your largest controllable operating expense. Overstaffing bleeds payroll margin, while understaffing burns out your top performers and spikes turnover rates.

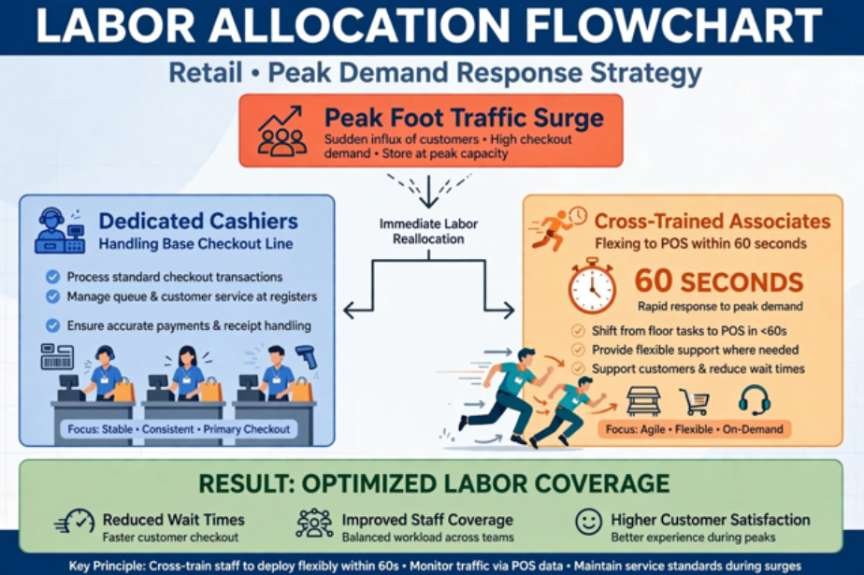
    Evaluating scheduling data alongside foot traffic reveals clear operational patterns. To maintain stable floor coverage, store operators often need to reduce absenteeism in shift work operations before attempting to re-engineer their shift rosters. When employees consistently call out, cross-trained staff absorb the impact, creating cascading bottlenecks across cash wraps and stockrooms.

                          [Peak Foot Traffic Surge]

                                       │

                        ┌──────────────┴──────────────┐

                        ▼                             ▼

            [Dedicated Cashiers]            [Cross-Trained Associates]

            Handles base checkout line      Flexes to POS within 60 seconds

    Tying Labor Hours to Transaction Volume

    Audit your schedules against peak door-counter trends rather than sales totals. Transaction totals lag behind foot traffic; shoppers leave empty-handed when customer service is absent.

    Calculate your labor efficiency by measuring the cost of employee turnover in hourly jobs formula across quarters. Stores that operate with structured, clear audit routines retain their floor staff significantly longer because expectations remain consistent and measurable.

    Inventory Accuracy, Receiving, and Backroom Flow

    A disorganized backroom reflects poor operational discipline throughout the store. If receiving takes twenty-four hours to log a pallet into your enterprise resource planning system, your inventory counts remain inaccurate for that entire operational window.

    I evaluate dock doors and processing areas on dock-to-stock velocity. Pallets sitting idle on a loading dock invite damage, theft, and inventory loss.

    Inventory Control Standard Benchmark Audit Method
    Cycle Counting ≥ 98% record accuracy across top SKUs Daily rolling counts of high-shrink categories
    Dock-to-Stock Speed Inbound shipments receipted in < 4 hours Timestamp verification from bill of lading to scan
    RTV (Return to Vendor) Damaged goods processed within 7 days Physical audit of dedicated quarantine shelving
    FIFO Rotation Zero expired or aged batches on active display Date-code inspection on rotating shelf displays

    Enforce strict First-In, First-Out (FIFO) procedures across all dated categories. Damaged goods must move to a secured Return to Vendor (RTV) area immediately rather than cluttering operational staging lanes.

    Checkout Throughput and POS Reliability

    The checkout area forms the final impression a shopper carries out the door. Long lines wipe out visual merchandising gains made on the sales floor.

    Harvard Business Review has highlighted that perceived checkout friction directly influences customer churn and lifetime value. Modern retail requires sub-three-minute queue times during baseline traffic.

    [Arrival at POS] ───► [Card / Tap Scan] ───► [Bagging & Receipt] ───► Target: < 180s

                                                                          Queue Time

    Audit your point-of-sale performance using these core checkpoints:

    1. Hardware Health: Test barcode scanners, receipt printers, and PIN pads daily before opening doors to eliminate transaction lag.
    2. Till Balancing: Enforce balanced drawer handovers with cash discrepancies kept strictly below three dollars per shift.
    3. Refund Friction: Keep returns under ninety seconds by equipping floor supervisors with mobile override credentials.

    Facility Safety, Compliance, and Shrink Defense

    Safety failures disrupt revenue faster than inventory mistakes. Non-compliance with standard workplace guidelines established by OSHA leads to costly citations and worker compensation claims that destroy store profitability.

    Loss prevention must be integrated into daily routines rather than treated as a separate security concern. Audit your cameras for blind spots caused by seasonal banners or shifted gondolas.

    Keep emergency egress routes, fire extinguishers, and electrical breaker panels clear of freight at all times. Verify that energy-management systems regulate heating, cooling, and display lighting automatically to prevent utility waste during non-operational hours.

    The Root-Cause Scoring Framework (Audit Benchmark)

    Standard pass/fail audits fail because they identify symptoms while ignoring underlying problems. When an operational item fails an inspection, categorize the issue using this root-cause scoring framework.

    Using productivity metrics every operations manager should track can help managers quantify the impact of these operational weaknesses and prioritize corrective action.

    Finding Category Diagnostic Definition Corrective Mandate
    Process Failure Standard operating procedure is outdated or missing Revise operational policy within 48 hours
    Training Deficit Associate unaware of correct operational execution Mandatory peer retraining within 5 operational days
    Systemic / Tool Breakdown Defective equipment, network lag, or broken software Escalate support ticket; bypass workflow temporarily

    Assign an operational score out of 100 for each department. Stores scoring below 85 require an operational re-audit within fourteen business days.

    Stop Auditing Like It’s 1999: Your Next Operational Move

    Clipboards belong in retail museums. If your team still conducts operational audits on paper sheets, transition to mobile audit software that logs photo evidence and assigns remediation tasks in real time.

    Pick two low-scoring areas from this checklist and run a baseline evaluation tomorrow morning before unlocking your doors. Give your store leaders the tools to locate friction, resolve it, and convert wasted labor hours into profitable floor execution.

    Frequently Asked Questions

    1. How often should a retail store conduct an operational efficiency audit?

    Run safety and POS checks daily, review stockrooms and merchandising weekly, and complete a full multi-point audit once a month.

    2. What is the most critical metric in a retail operational audit?

    Inventory record accuracy is paramount because corrupted stock data skews purchasing, fulfillment, and customer satisfaction simultaneously.

    3. How does an operational audit reduce store shrinkage?

    Audits identify CCTV blind spots, enforce disciplined receiving scans, and uncover phantom inventory before theft compounds.

    4. Can small independent retailers use this audit structure effectively?

    Yes, simply adapt the checkpoints to your footprint and focus primarily on POS reliability, shelf pricing, and backroom inventory counts.

  • How to Reduce Absenteeism in Shift Work Operations: A Plant Manager’s Playbook

    How to Reduce Absenteeism in Shift Work Operations: A Plant Manager’s Playbook

    A 2:00 AM radio call announcing that your line operator called out sick throws the whole production schedule into chaos. After fifteen years managing 24/7 manufacturing plants, I learned the hard way that punitive point systems never prevent that call. If you want to know how to reduce absenteeism in shift work operations, you must address the core biological, logistical, and cultural drivers of burnout.

    When shift workers experience chronic circadian misalignment, unplanned call-outs are inevitable. Unplanned absences hammer production capacity, inflate overtime, and distort your metrics when you calculate labor cost percentage across alternating shifts.

    Here is the operational framework I used to drop unplanned absenteeism across our hourly shifts from 9.8% to under 3.2%.

    Shift Design: Aligning Schedules with Human Biology

    Shift Design Aligning Schedules with Human Biology

    Most attendance problems stem from schedules that wage war on the human nervous system. Traditional “clopening” rosters—where an employee closes a facility late at night and returns early the next morning—destroy restorative sleep patterns.

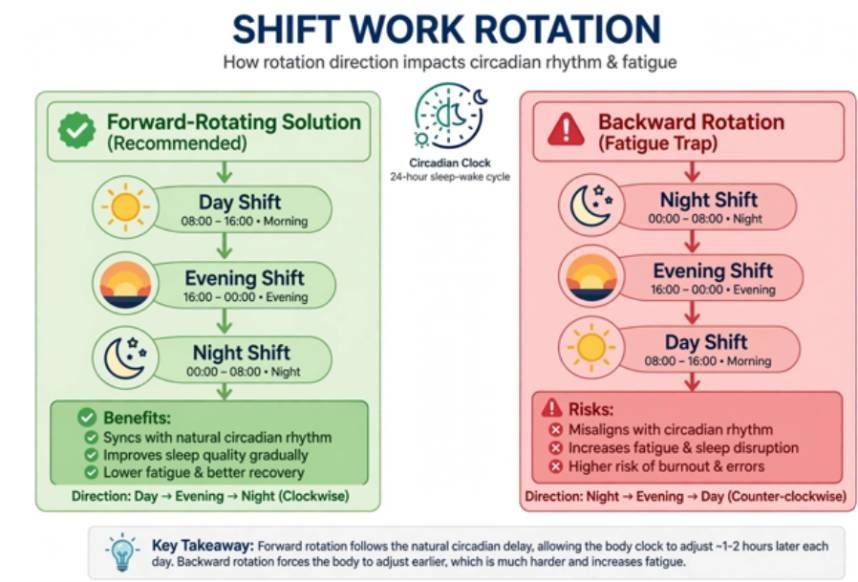
    Forward Rotation (Recommended):   Day Shift  –>  Evening Shift  –>  Night Shift

    Backward Rotation (Fatigue Trap): Night Shift –>  Evening Shift  –>  Day Shift

    The Forward-Rotating Solution

    According to research from CDC NIOSH, irregular schedules disrupt natural sleep rhythms, elevating workplace errors and fatigue-related absences. I immediately eliminated backward rotations across our lines. 

    We adopted a strict forward-rotating pattern (Day $\to$ Evening $\to$ Night) that works alongside circadian physiology. Our teams now keep night shifts consolidated into short, predictable blocks, giving their bodies adequate time to adjust.

    Roster Lead Times and Shift Autonomy

    Roster Lead Times and Shift Autonomy

    Life happens outside the plant. When rosters post only 48 hours in advance, employees call out sick simply to handle routine family obligations.

    Managers should also know how to handle peer conflict among frontline workers when scheduling pressures or shift changes create friction within the team. We enforce a four-week roster publishing lead time.

    We enforce a four-week roster publishing lead time. Giving workers digital self-scheduling access directly cut our non-sickness call-outs by 40%.

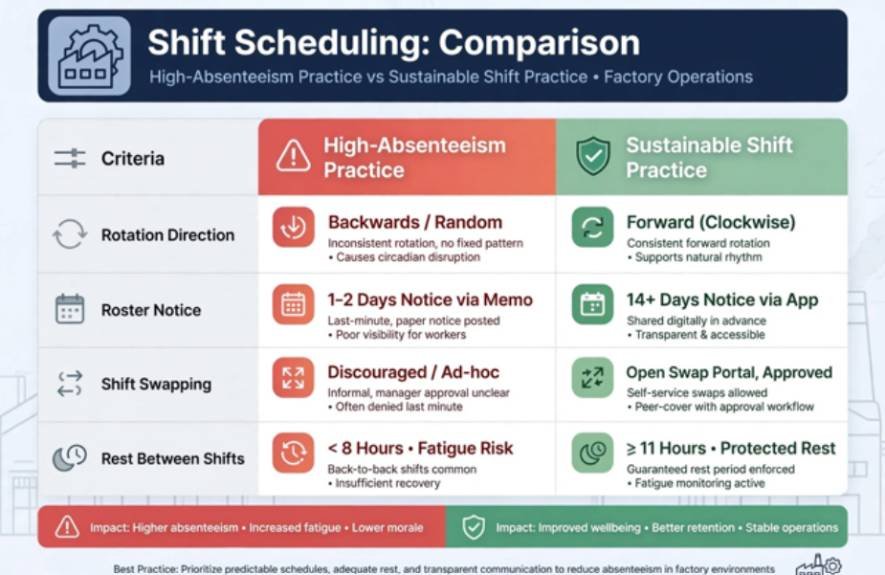
    Scheduling Factor High-Absenteeism Practice Sustainable Shift Practice
    Rotation Direction Backward (Night $\to$ Day) Forward (Day $\to$ Evening $\to$ Night)
    Roster Notice 3 to 5 days advance notice 3 to 4 weeks advance notice
    Shift Swapping Requires paper forms and multi-manager sign-offs Mobile app self-service with peer-to-peer sign-off
    Rest Between Shifts Under 11 hours (“clopening”) Minimum 12 to 16 hours continuous rest

    Frictionless Absence Reporting and Peer-to-Peer Swaps

    Frictionless Absence Reporting and Peer-to-Peer Swaps

    Workers dread calling supervisors to report an illness because they anticipate hostility or disciplinary pushback. This friction causes employees to delay notifications until ten minutes before shift start.

    We replaced the intimidating supervisor call with a simple, automated digital call-out portal featuring a three-hour advance notice window. When workers know reporting illness does not trigger an interrogation, they alert leadership early. That cushion gives shift supervisors adequate time to adjust lines without scrambling.

    Pair this protocol with peer-to-peer mobile shift swapping. When an employee encounters a family conflict, they trade directly with a qualified peer through a smartphone app. Giving frontline staff scheduling flexibility prevents unexcused absences and protects operational stability, keeping you from bearing the steep cost of employee turnover in hourly jobs formula.

    Metrics That Matter: Calculating Attendance Health

    Metrics That Matter Calculating Attendance Health

    You cannot manage what you do not track accurately. Traditional attendance tracking treats all missed shifts identically. A worker taking one 10-day medical leave damages operations far less than an employee taking 10 sporadic, unplanned single-day absences.

    Understanding how to calculate labor cost percentage for small business operations can also help managers measure how absenteeism and overtime affect overall labor spending.

    The Bureau of Labor Statistics monitors occupational absence rates, but shop-floor operators require sharper analytical granularity. I measure three distinct parameters:

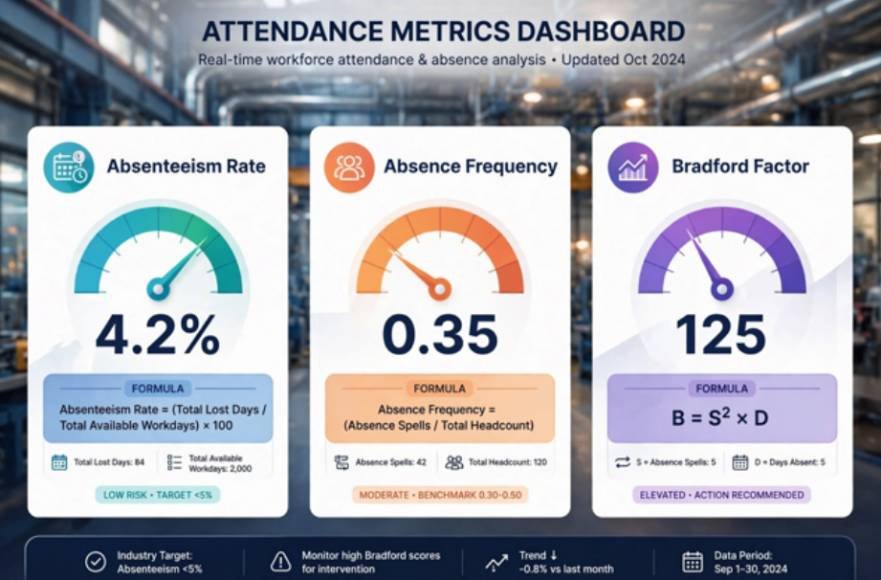
    Metric Formula Primary Diagnostic Value
    Absenteeism Rate $\left(\frac{\text{Total Lost Days}}{\text{Total Available Workdays}}\right) \times 100$ Measures aggregate operational capacity lost.
    Absence Frequency $\frac{\text{Absence Spells}}{\text{Total Headcount}}$ Isolates isolated events from widespread culture trends.
    Bradford Factor ($B$) $B = S^2 \times D$ Spots disruptive, short-term unplanned patterns.

    In the Bradford Factor formula, $S$ equals total separate absence spells over 52 weeks, and $D$ equals total absent days.

    Floor Countermeasures and Circadian Support

    Managing fatigue requires supportive engineering controls on the plant floor. Environmental design standards outlined by OSHA highlight how poor rest spaces and sustained physical loads exacerbate industrial fatigue.

    We retrofitted our operating facilities with three primary environmental countermeasures:

    • Circadian Lighting Installations: We installed dynamic, high-lux (750+ lux), blue-enriched LED task lighting in assembly and packaging areas to suppress melatonin during the 2:00 AM–4:00 AM circadian trough.
    • Thermal-Regulated Rest Zones: Break rooms should feature warm, dimmable lights and cool temperatures ($65^\circ\text{F}$ to $68^\circ\text{F}$) so resting workers can reset.
    • Ergonomic Vibration and Impact Relief: Anti-fatigue matting combined with mandatory 7-minute micro-stretch rotations during mid-shift handovers reduces the cumulative musculoskeletal strain that drives medical leaves.

    The 3-Minute Supportive Return-to-Work (RTW) Framework

    Every absence requires an immediate, private, and supportive check-in before the employee resumes floor duties. As documented in managerial leadership studies from Harvard Business Review, supportive operational inquiries yield significantly better compliance than punitive reprimands.

    We train supervisors to use this standard five-point conversation sequence:

    1. Welcome: Greet the worker warmly and eliminate anxiety (“Welcome back, glad you’re here. How are you feeling?”).
    2. Safety & Fitness: Check physical capability (“Are you 100% recovered to operate heavy machinery today?”).
    3. Accommodate: Adjust station assignments if lingering physical strain remains.
    4. Operational Sync: Provide a 60-second summary of equipment updates or line adjustments that occurred during their leave.
    5. Root Cause & Support: Highlight available resources like Employee Assistance Programs (EAP) or shift-swap tools if personal burnout triggered the absence.

    Holding this supportive conversation for every absence removes the perception of unfair targeting while deterring casual absenteeism.

    Stop Managing Bad Luck, Start Fixing Broken Shifts

    High absenteeism is rarely an individual employee character flaw; it is an early warning indicator of operational dysfunction. 

    When shift designs respect human biology, scheduling tools grant autonomy, and leaders conduct supportive return checks, attendance stabilizes naturally. 

    Pick one operational lever today: audit your scheduling pattern, eliminate rapid rotations, and watch your floor attendance rebound.

    Frequently Asked Questions

    1. What is an acceptable absenteeism rate for shift operations?

    Industry standards generally sit between 2% and 4%; anything consistently above 5% signals systemic scheduling or morale problems.

    2. How does night shift work specifically affect absence rates?

    Night work disrupts circadian biology, often cutting deep restorative sleep by 2 to 4 hours and increasing vulnerability to illness.

    3. What is the Bradford Factor threshold for intervention?

    A Bradford score above 250 points typically triggers formal supervisory check-ins, while scores above 500 indicate severe operational disruption.

    4. Does a four-day workweek reduce shift work absenteeism?

    Transitioning from five 8-hour shifts to four 10-hour shifts frequently reduces call-outs by granting workers three consecutive days of circadian recovery.

  • Cost of Employee Turnover in Hourly Jobs Formula: The Complete Guide

    Cost of Employee Turnover in Hourly Jobs Formula: The Complete Guide

    Losing a $15-an-hour worker never costs just $15 an hour. When I managed my first 100-person logistics center, I assumed an empty shift cost zero dollars because unpaid hours saved payroll. My ledger proved me dead wrong.

    Applying the exact cost of employee turnover in hourly jobs formula revealed that every departure drained over $10,000 from our operating margins. Once you calculate labor cost percentage alongside true separation, onboarding, and ramp deficits, hourly turnover exposes itself as a massive cash drain.

    The Standard Turnover Calculation Formula for Hourly Roles

    The Standard Turnover Calculation Formula for Hourly Roles

    Most operations teams rely on arbitrary rules of thumb. To control payroll leakage, use this operational formula:

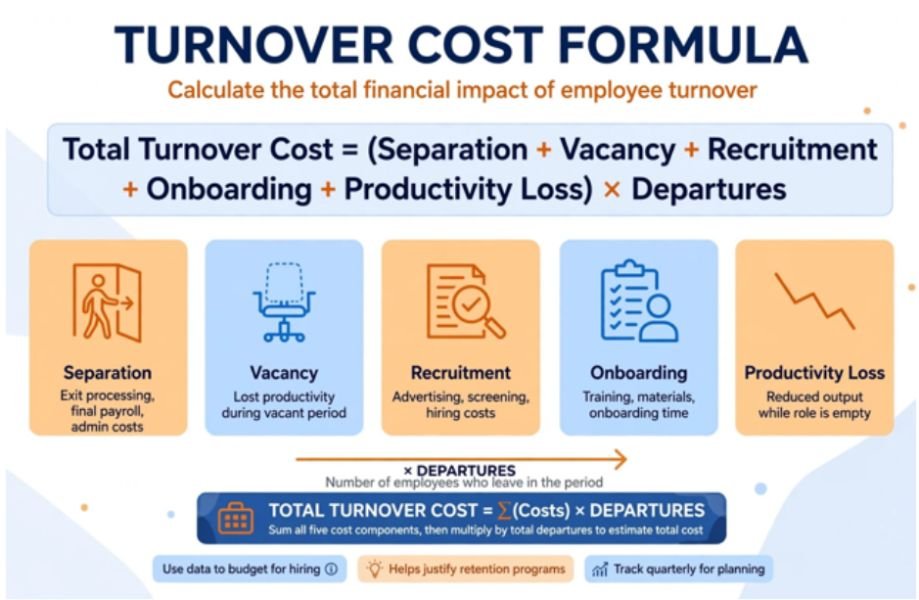
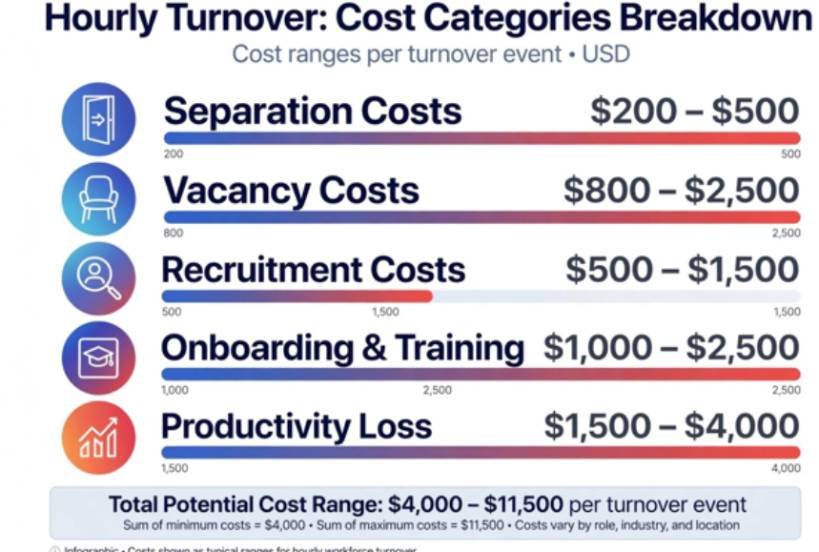
    $$\text{Total Turnover Cost} = (\text{Separation} + \text{Vacancy} + \text{Recruitment} + \text{Onboarding} + \text{Productivity Loss}) \times \text{Departures}$$

    According to data tracked by the U.S. Bureau of Labor Statistics, hourly churn rates regularly surpass salaried professions. This reality requires granular tracking across five primary cost buckets.

    Breaking Down the Core Cost Variables

    Breaking Down the Core Cost Variables

    Cost Category Direct Operational Drivers Typical Cost Range (Per Leaver)
    Separation Costs Exit processing, HR paperwork, payroll termination, accrued PTO payouts $200 – $500
    Vacancy Costs Overtime wage premiums, temporary staffing margins, supervisor coverage $800 – $2,500
    Recruitment Costs Job boards, screening, background checks, manager interview hours $500 – $1,500
    Onboarding & Training Trainer wages, LMS licensing, unearned new-hire wages during training $1,000 – $2,500
    Productivity Loss Slower pick/pack rates, customer errors, scrap, ramp-up lag (weeks 1–4) $1,500 – $4,000

    Industry research from the Society for Human Resource Management (SHRM) shows that replacing entry-level staff runs between 30% and 50% of an employee’s annual wages. For quick-service roles with zero technical onboarding, lean operators sometimes use flat estimates of $1,500 to $4,000.

    Real-World Cost Model: Warehouse Operations

    Real-World Cost Model Warehouse Operations

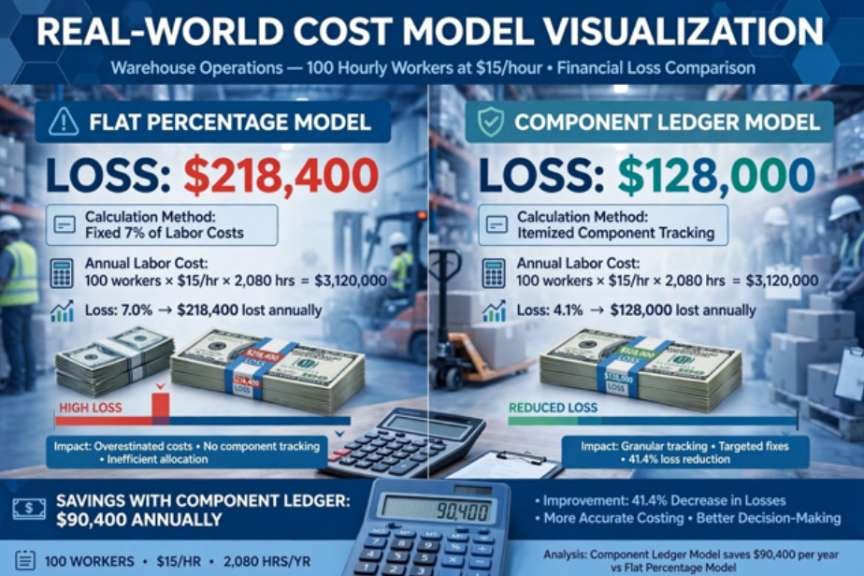
    Consider a distribution facility running 100 hourly workers earning $15 per hour. At 2,080 annual work hours, each full-time worker earns $31,200 annually.

    For a broader view of workforce expenses, you can also calculate labor cost percentage for small business operations to measure labor spending against revenue.

    A 20% annual turnover rate produces 20 departures per year.

    Benchmark Multiplier vs. Component Tracking

    Metric Flat Percentage Model (35%) Component Ledger Model
    Annual Wage Base $31,200 $31,200
    Cost Per Departure $10,920 $6,400 (Direct hard costs)
    Annual Departures 20 workers 20 workers
    Annual Facility Loss $218,400 $128,000

    The percentage benchmark captures soft productivity drag that traditional ledgers miss. Even when sticking purely to hard receipts, 20 lost workers wipe out over $128,000 in bottom-line cash.

    Two Hidden Leaks That Inflate Hourly Replacement Costs

    Standard financial models fail hourly employers because they treat front-line labor like salaried staff. Two operational mechanisms spike the true replacement bill.

    The Overtime Premium Multiplier

    The Overtime Premium Multiplier

    When an engineer leaves an office job, the work waits. When an hourly material handler leaves, the production line halts unless covered immediately.

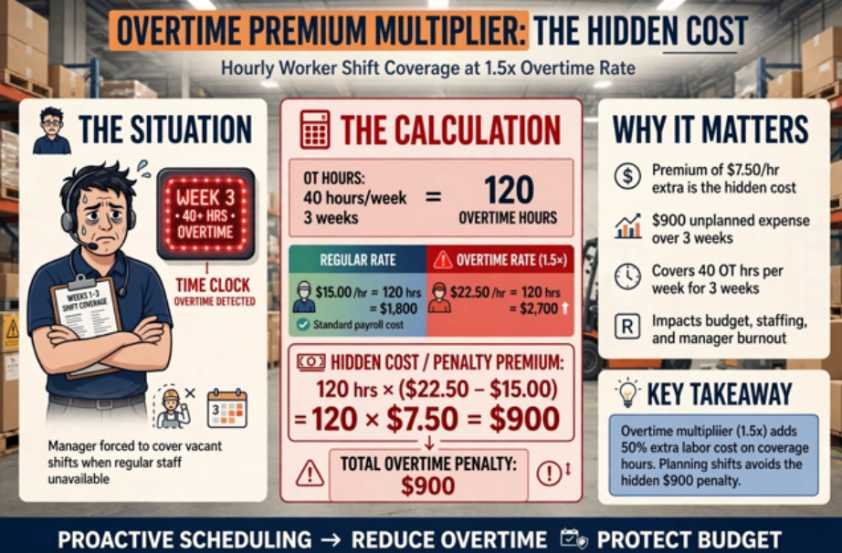
    Managers cover these open shifts using existing staff at 1.5x overtime rates.

    A fair workweek compliance checklist for multi-unit businesses can also help managers plan schedules consistently and reduce avoidable last-minute changes that increase labor costs.

    While new employees require structured training before they can fully contribute.

    An onboarding checklist for high turnover service industries can help standardize that transition and reduce the productivity gap.

    $$\text{Overtime Premium} = \text{Open Hours} \times (\text{Overtime Rate} – \text{Base Wage})$$

    Covering a single 40-hour shift for three weeks at $15/hr creates $900 in unbudgeted overtime penalties:

    $$40 \text{ hours} \times 3 \text{ weeks} \times (\$22.50 – \$15.00) = \$900$$

    The FUTA and SUTA Tax Reset Penalty

    Payroll taxes reset on new hires. The Internal Revenue Service (IRS) caps the Federal Unemployment Tax Act (FUTA) wage base at $7,000 per worker per year. Most State Unemployment Tax Acts (SUTA) follow similar caps.

    Tax Parameter Stable Seat (1 Worker Retained) High-Churn Seat (3 Consecutive Workers)
    Taxable FUTA Wage Base $7,000 max $21,000 (Resets to $0 with each new hire)
    FUTA Paid (Effective 0.6%) $42.00 $126.00
    SUTA Impact (e.g., $9,000 cap @ 4%) $360.00 $1,080.00
    Excess Statutory Tax Paid $0.00 +$804.00 per churned seat

    Cycling three people through the same physical job within a single calendar year multiplies statutory payroll tax liability across identical hours worked.

    Stop Bleeding Payroll: Your Retention Action Plan

    Plugging operational leaks produces an immediate financial return. A $1.00 hourly wage increase across 100 workers costs $208,000 annually. If that raise cuts your turnover from 35% down to 15%, you save 20 departures—or roughly $218,400 in replacement costs. The wage bump funds itself while securing operational output. Audit your vacancy overtime this week, run your component totals, and protect your margins.

    Frequently Asked Questions 

    1. What is the fastest way to calculate hourly turnover cost?

    Multiply the worker’s annual earnings by 0.35 to get a reliable benchmark replacement estimate.

    2. How does employee vacancy cost differ in hourly positions?

    Hourly roles require immediate mandatory coverage, triggering expensive 1.5x overtime rates or third-party staffing markup fees.

    3. Why does high hourly turnover increase employer payroll taxes?

    FUTA and SUTA wage bases reset to zero whenever an employee is replaced within the same calendar year.

    4. What is an acceptable turnover rate for hourly jobs?

    Rates vary by industry, but top-tier operations maintain turnover below 20% to 25% annually.

  • How to Calculate Labor Cost Percentage for Small Business: Step-by-Step Formula

    How to Calculate Labor Cost Percentage for Small Business: Step-by-Step Formula

    Your payroll reports might show steady hourly wages, yet your operating checking account mysteriously runs dry by month’s end. When I audited my first service business, I realized gross wages represent only two-thirds of actual workforce expenses. Mastering how to calculate labor cost percentage for small business operations reveals precisely what share of every revenue dollar keeps your team functioning.

    If that number climbs untracked, your business subsidizes inefficiency instead of producing profit.

    The Core Labor Cost Percentage Formula

    The Core Labor Cost Percentage Formula

    The calculation divides total burdened labor expenses by gross operational revenue across identical accounting windows:

    $$\text{Labor Cost Percentage} = \left(\frac{\text{Total Labor Cost}}{\text{Total Revenue}}\right) \times 100$$

    Both figures must stem from the identical calendar window. Mismatched accrual dates produce deceptive ratios.

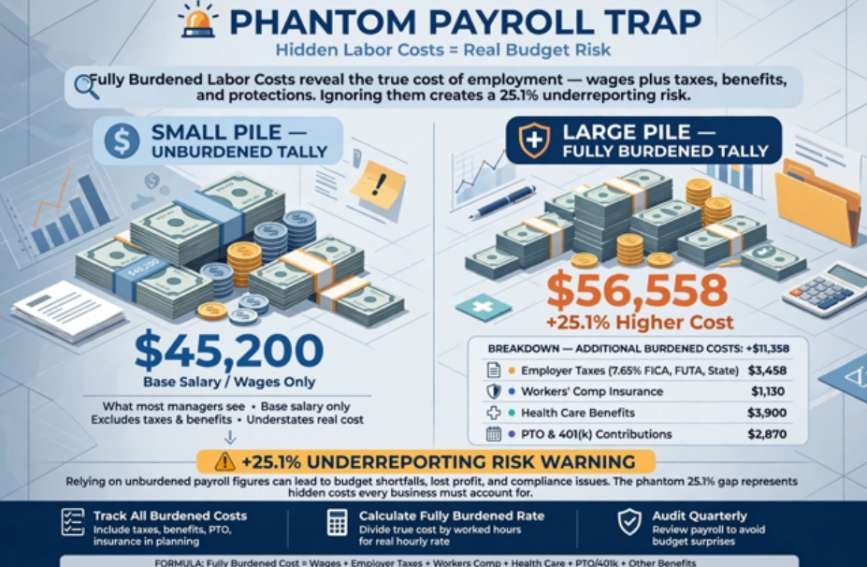
    Step 1: Quantify Fully Burdened Labor Costs (Avoid the Phantom Payroll Trap)

    Step 1 Quantify Fully Burdened Labor Costs (Avoid the Phantom Payroll Trap)

    The most damaging mistake I see operators make involves tallying hourly wages alone. Federal and state mandates, benefits, and insurance create an expense layer known as the labor burden.

    According to data compiled by the U.S. Bureau of Labor Statistics, non-wage benefits and statutory contributions account for roughly 30% of total employer compensation costs across private industry. Ignoring these items causes the “Phantom Payroll Trap”—an artificial margin that blinds you to operational losses.

    Your total labor figure must encompass all compensation commitments defined under IRS Publication 15:

    • Direct Compensation: Base wages, salaried payroll, production bonuses, commissions, tips paid by the house, and overtime premiums.
    • Statutory Employer Contributions: Employer-paid FICA (6.2% Social Security, 1.45% Medicare), federal unemployment tax (FUTA), and state unemployment insurance (SUTA).
    • Mandatory and Discretionary Benefits: Workers’ compensation insurance premiums, employer-paid medical/dental plans, and retirement match contributions.
    • Compensated Absence Accruals: Paid time off, holiday pay, and accrued bereavement or sick leave.
    • Owner-Operator Market Salary: If you manage daily tasks without a scheduled payroll draw, include your replacement market wage. Free owner labor masks operational insolvency.

    Burdened vs. Unburdened Labor Expense Breakdown

    The table below illustrates how true payroll burden expands total labor overhead for an eight-person staff:

    Cost Component Unburdened Tally True Fully Burdened Tally Notes on Variance
    Gross Wages & Salaries $42,000 $42,000 Base hourly and exempt payroll
    Overtime Premiums $3,200 $3,200 Time-and-a-half allocations
    Employer Payroll Taxes $0 (omitted) $3,458 FICA, FUTA, and SUTA obligations
    Workers’ Comp & Health Care $0 (omitted) $5,800 Premiums allocated per period
    PTO Accruals & 401(k) Match $0 (omitted) $2,100 Earned leave plus company match
    Total Labor Cost Figure $45,200 $56,558 +25.1% underreporting risk

    Calculating against $45,200 yields false confidence. You must run ratios against $56,558.

    Step 2: Establish Matched Gross Revenue

    Gross revenue comprises total top-line sales receipts generated during the corresponding calendar cycle. Pull this number straight from your point-of-sale or accounting software before subtracting operating expenses, inventory costs, or debt service.

    If calculating for an April 1–April 30 payroll window, match it against April 1–April 30 gross billings. Mixing two-week payroll cadences with monthly sales aggregates distorts your percentage by up to 14%.

    The U.S. Small Business Administration highlights that aligning accounting periods ensures accurate operational forecasting.

    Businesses operating across multiple locations should also maintain consistent scheduling practices and review a fair workweek compliance checklist for multi-unit businesses to keep labor planning organized.

    Step 3: Run the Calculation with a Real-World Scenario

    Step 3 Run the Calculation with a Real-World Scenario

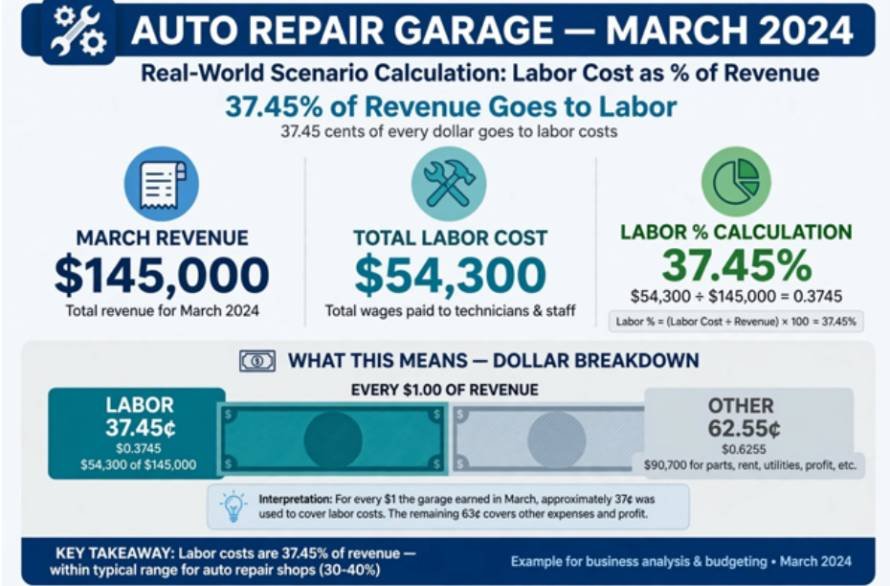
    Let us evaluate an independent auto repair garage assessing its financial performance for March:

    • Gross Sales (Total Revenue): $145,000
    • Hourly Tech & Service Writer Wages: $36,000
    • Employer Taxes, Workers’ Comp, & Benefits: $11,800
    • Owner-Operator Working Wage: $6,500
    • Total Fully Burdened Labor: $54,300

    $$\text{Labor Cost Percentage} = \left(\frac{\$54,300}{\$145,000}\right) \times 100 = 37.45\%$$

    Labor consumes 37.45 cents of every dollar entering the register.

    Industry Benchmarks: What Does a Healthy Percentage Look Like?

    Industry Benchmarks What Does a Healthy Percentage Look Like

    Safe payroll thresholds vary widely by sector. Research from hospitality institutions like the Cornell University School of Hotel Administration demonstrates that customer-facing hospitality models require elevated staffing levels, whereas capital-heavy sectors prioritize asset utilization over headcount.

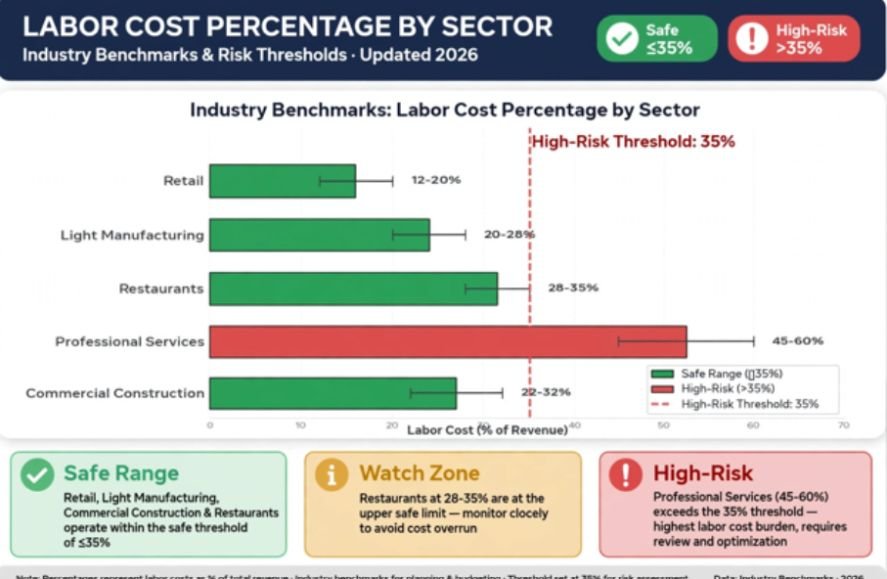
    Industry Vertical Typical Safe Range High-Risk Margin Threshold Primary Driver
    Retail & E-commerce 12% – 20% > 25% Automated checkout & self-service merchandising
    Light Manufacturing 20% – 28% > 32% Capital equipment vs. assembly-line headcount
    Restaurants & Hospitality 28% – 35% > 38% Shift prep, table service, and kitchen staffing
    Professional Services 45% – 60% > 65% Billable talent constitutes the inventory sold
    Commercial Construction 22% – 32% > 36% Project-based craft trades and union rates

    Four Strategic Levers to Optimize Your Labor Ratio

    When margins tighten, knee-jerk layoffs harm company morale. Preventing burnout among customer-facing staff is another important part of maintaining productivity without simply increasing headcount. Protect profits with operational adjustments first:

    Protect profits with operational adjustments first:

    1. Schedule to Sales Demand Curves: Map historical revenue velocity by hourly intervals. Stagger shift starts to match real foot traffic rather than staffing arbitrary eight-hour blocks.
    2. Track Labor Cost Per Unit Produced: In service or manufacturing workflows, calculate labor cost per repair order, meal served, or pallet packed. Monitoring workload and team efficiency can also help identify issues that contribute to peer conflict among frontline workers. Team efficiency becomes visible immediately.
    3. Automate Administrative Overhead: Eliminate repetitive clerical tasks. Route appointment scheduling, standard billing queries, and timesheet logging through digital software.
    4. Tie Incentive Pay to Gross Margin: Swap discretionary annual perks for performance-based bonuses funded exclusively when team labor metrics remain below target.

    Frequently Asked Questions

    1. Should contract 1099 labor be included in the formula?

    Yes, add 1099 payments when contractors perform operational production tasks directly tied to core revenue generation.

    2. How often should small businesses calculate labor cost percentages?

    Calculate your percentage weekly for hourly operations like restaurants, and monthly for salaried professional firms.

    3. Does overtime pay inflate this percentage permanently?

    Overtime raises the ratio immediately because premium pay increases labor expenses without producing proportional revenue gains.

    4. Why do professional service firms sustain higher labor cost percentages?

    Consulting, accounting, and legal practices sell intellectual labor rather than raw physical goods, creating minimal material expenses.

    Stop Bleeding Cash: Your Weekly Action Blueprint

    Operating without tracking your labor cost percentage resembles driving cross-country with a broken fuel gauge. Download your latest monthly payroll summary, pull your gross revenue report, apply the fully burdened formula, and plot your number against your industry’s safe threshold. If your labor sits five points above average, restructure shift scheduling and trim non-productive overtime this week.