
Losing a $15-an-hour worker never costs just $15 an hour. When I managed my first 100-person logistics center, I assumed an empty shift cost zero dollars because unpaid hours saved payroll. My ledger proved me dead wrong.
Applying the exact cost of employee turnover in hourly jobs formula revealed that every departure drained over $10,000 from our operating margins. Once you calculate labor cost percentage alongside true separation, onboarding, and ramp deficits, hourly turnover exposes itself as a massive cash drain.
The Standard Turnover Calculation Formula for Hourly Roles
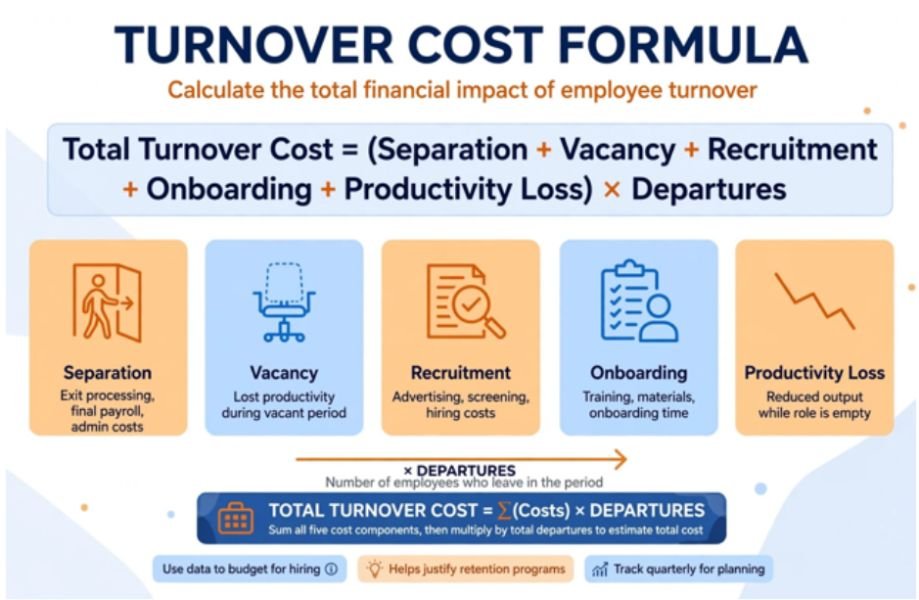
Most operations teams rely on arbitrary rules of thumb. To control payroll leakage, use this operational formula:
$$\text{Total Turnover Cost} = (\text{Separation} + \text{Vacancy} + \text{Recruitment} + \text{Onboarding} + \text{Productivity Loss}) \times \text{Departures}$$
According to data tracked by the U.S. Bureau of Labor Statistics, hourly churn rates regularly surpass salaried professions. This reality requires granular tracking across five primary cost buckets.
Breaking Down the Core Cost Variables
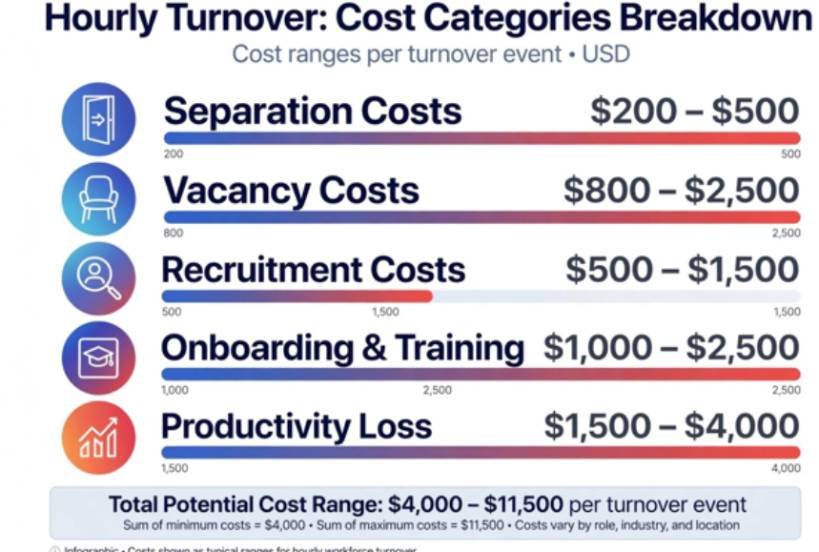
| Cost Category | Direct Operational Drivers | Typical Cost Range (Per Leaver) |
| Separation Costs | Exit processing, HR paperwork, payroll termination, accrued PTO payouts | $200 – $500 |
| Vacancy Costs | Overtime wage premiums, temporary staffing margins, supervisor coverage | $800 – $2,500 |
| Recruitment Costs | Job boards, screening, background checks, manager interview hours | $500 – $1,500 |
| Onboarding & Training | Trainer wages, LMS licensing, unearned new-hire wages during training | $1,000 – $2,500 |
| Productivity Loss | Slower pick/pack rates, customer errors, scrap, ramp-up lag (weeks 1–4) | $1,500 – $4,000 |
Industry research from the Society for Human Resource Management (SHRM) shows that replacing entry-level staff runs between 30% and 50% of an employee’s annual wages. For quick-service roles with zero technical onboarding, lean operators sometimes use flat estimates of $1,500 to $4,000.
Real-World Cost Model: Warehouse Operations
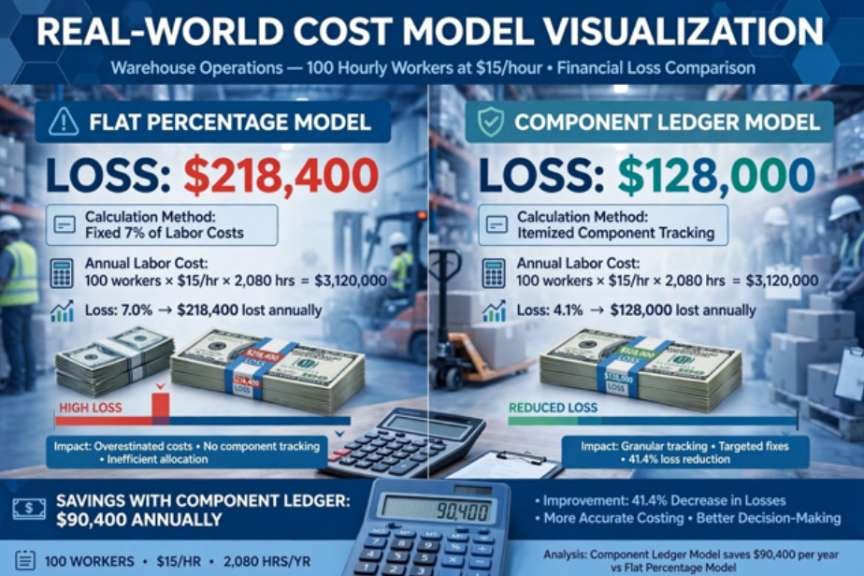
Consider a distribution facility running 100 hourly workers earning $15 per hour. At 2,080 annual work hours, each full-time worker earns $31,200 annually.
For a broader view of workforce expenses, you can also calculate labor cost percentage for small business operations to measure labor spending against revenue.
A 20% annual turnover rate produces 20 departures per year.
Benchmark Multiplier vs. Component Tracking
| Metric | Flat Percentage Model (35%) | Component Ledger Model |
| Annual Wage Base | $31,200 | $31,200 |
| Cost Per Departure | $10,920 | $6,400 (Direct hard costs) |
| Annual Departures | 20 workers | 20 workers |
| Annual Facility Loss | $218,400 | $128,000 |
The percentage benchmark captures soft productivity drag that traditional ledgers miss. Even when sticking purely to hard receipts, 20 lost workers wipe out over $128,000 in bottom-line cash.
Two Hidden Leaks That Inflate Hourly Replacement Costs
Standard financial models fail hourly employers because they treat front-line labor like salaried staff. Two operational mechanisms spike the true replacement bill.
The Overtime Premium Multiplier
When an engineer leaves an office job, the work waits. When an hourly material handler leaves, the production line halts unless covered immediately.
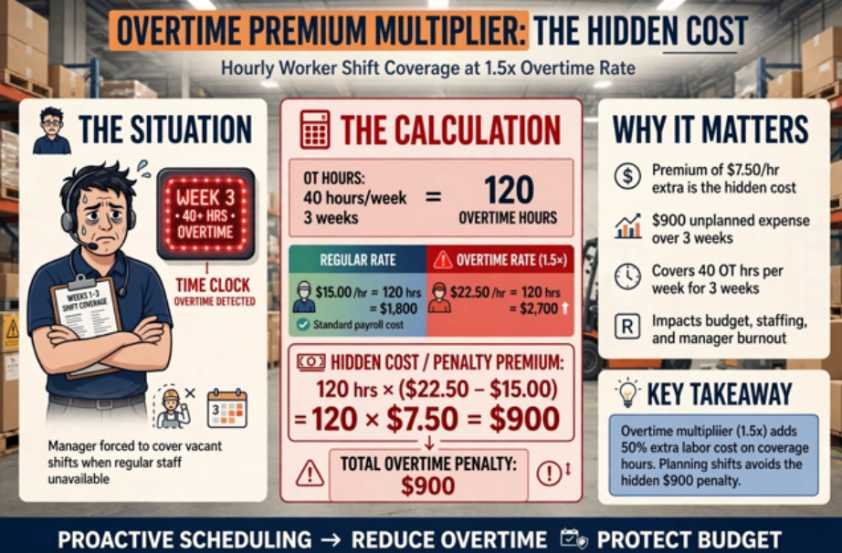
Managers cover these open shifts using existing staff at 1.5x overtime rates.
A fair workweek compliance checklist for multi-unit businesses can also help managers plan schedules consistently and reduce avoidable last-minute changes that increase labor costs.
While new employees require structured training before they can fully contribute.
An onboarding checklist for high turnover service industries can help standardize that transition and reduce the productivity gap.
$$\text{Overtime Premium} = \text{Open Hours} \times (\text{Overtime Rate} – \text{Base Wage})$$
Covering a single 40-hour shift for three weeks at $15/hr creates $900 in unbudgeted overtime penalties:
$$40 \text{ hours} \times 3 \text{ weeks} \times (\$22.50 – \$15.00) = \$900$$
The FUTA and SUTA Tax Reset Penalty
Payroll taxes reset on new hires. The Internal Revenue Service (IRS) caps the Federal Unemployment Tax Act (FUTA) wage base at $7,000 per worker per year. Most State Unemployment Tax Acts (SUTA) follow similar caps.
| Tax Parameter | Stable Seat (1 Worker Retained) | High-Churn Seat (3 Consecutive Workers) |
| Taxable FUTA Wage Base | $7,000 max | $21,000 (Resets to $0 with each new hire) |
| FUTA Paid (Effective 0.6%) | $42.00 | $126.00 |
| SUTA Impact (e.g., $9,000 cap @ 4%) | $360.00 | $1,080.00 |
| Excess Statutory Tax Paid | $0.00 | +$804.00 per churned seat |
Cycling three people through the same physical job within a single calendar year multiplies statutory payroll tax liability across identical hours worked.
Stop Bleeding Payroll: Your Retention Action Plan
Plugging operational leaks produces an immediate financial return. A $1.00 hourly wage increase across 100 workers costs $208,000 annually. If that raise cuts your turnover from 35% down to 15%, you save 20 departures—or roughly $218,400 in replacement costs. The wage bump funds itself while securing operational output. Audit your vacancy overtime this week, run your component totals, and protect your margins.
Frequently Asked Questions
1. What is the fastest way to calculate hourly turnover cost?
Multiply the worker’s annual earnings by 0.35 to get a reliable benchmark replacement estimate.
2. How does employee vacancy cost differ in hourly positions?
Hourly roles require immediate mandatory coverage, triggering expensive 1.5x overtime rates or third-party staffing markup fees.
3. Why does high hourly turnover increase employer payroll taxes?
FUTA and SUTA wage bases reset to zero whenever an employee is replaced within the same calendar year.
4. What is an acceptable turnover rate for hourly jobs?
Rates vary by industry, but top-tier operations maintain turnover below 20% to 25% annually.
Leave a Reply