
I spent fifteen years watching store managers run paper audits that changed nothing. They checked boxes, filed clipboards into filing cabinets, and watched shrinkage creep upward anyway. An operational efficiency audit checklist for retail stores must serve as an active diagnostic instrument, not an administrative chore.
If your current store audit does not uncover why your payroll leaks or why checkout queues stall, scrap it. Modern retail margins leave no room for vanity inspections.
According to research by the National Retail Federation, inventory distortion and operational shrinkage continue to drain billions from brick-and-mortar balance sheets annually. Real store efficiency begins when your team diagnoses friction at the point of execution.
Store Operational Health Model
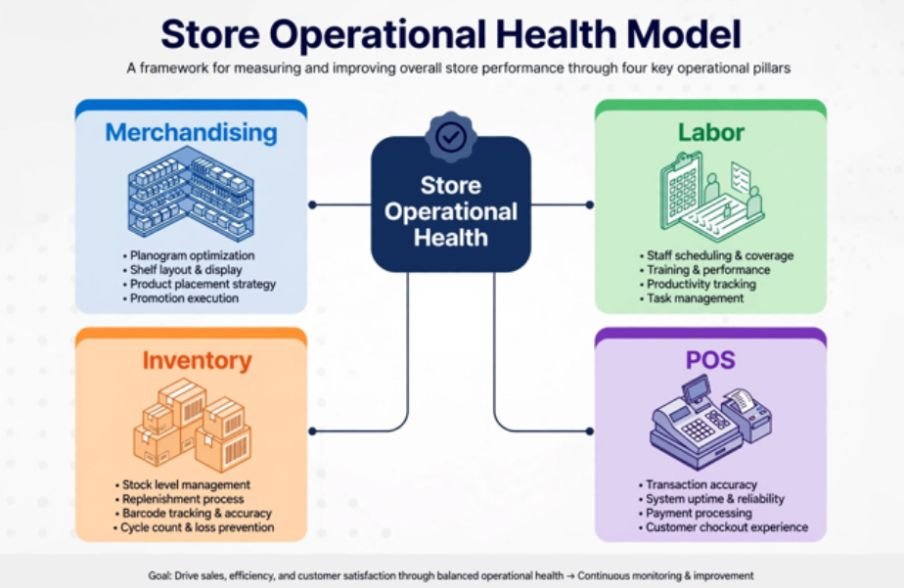
┌────────────────────────────────┐
│ Store Operational Health │
└───────────────┬────────────────┘
│
┌────────────────┬──────────────┴───────────────┬────────────────┐
│ │ │ │
[Merchandising] [Labor] [Inventory] [POS]
- Planograms • Traffic-to-labor match • Cycle counts • Queue time
- Eye-level tags • Cross-trained cashiers • FIFO / RTV • Hardware speed
Storefront Visuals and Merchandising Execution

Your sales floor is either an engine of conversion or a maze of missed opportunities. Visual merchandising must do more than look pretty; it must funnel foot traffic directly toward high-velocity inventory.
When conducting a floor audit, I inspect planogram compliance with a critical eye. Shelf misalignment creates phantom stockouts—inventory that exists in the system but remains invisible to the customer.
| Inspection Focus | Standard Benchmark | Friction Indicator |
| Promotional Signage | 100% current campaign alignment | Expired sale tags still displayed on endcaps |
| Eye-Level Stocking | Top 20% velocity SKUs placed at 48″–60″ | High-margin merchandise buried on bottom shelves |
| Planogram Adherence | ≥ 95% SKU position accuracy | Arbitrary product substitutions made by floor staff |
| Shelf Labeling | Zero price mismatches against POS database | Price discrepancy between shelf tag and terminal |
Audit digital and paper shelf tags against your point-of-sale pricing engine weekly. A single mismatched SKU damages customer trust and slows down terminal throughput during morning rushes.
Labor Allocation and Shift Productivity
Labor represents your largest controllable operating expense. Overstaffing bleeds payroll margin, while understaffing burns out your top performers and spikes turnover rates.
Evaluating scheduling data alongside foot traffic reveals clear operational patterns. To maintain stable floor coverage, store operators often need to reduce absenteeism in shift work operations before attempting to re-engineer their shift rosters. When employees consistently call out, cross-trained staff absorb the impact, creating cascading bottlenecks across cash wraps and stockrooms.
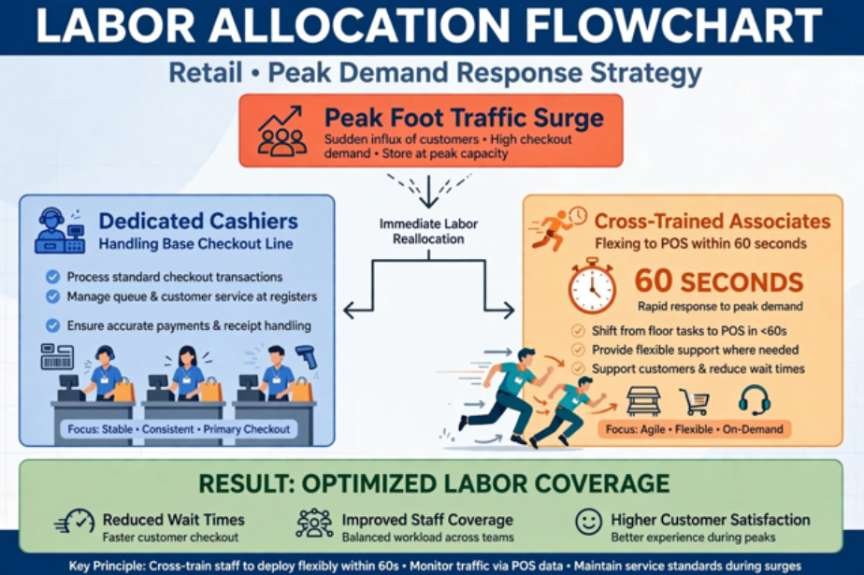
[Peak Foot Traffic Surge]
│
┌──────────────┴──────────────┐
▼ ▼
[Dedicated Cashiers] [Cross-Trained Associates]
Handles base checkout line Flexes to POS within 60 seconds
Tying Labor Hours to Transaction Volume
Audit your schedules against peak door-counter trends rather than sales totals. Transaction totals lag behind foot traffic; shoppers leave empty-handed when customer service is absent.
Calculate your labor efficiency by measuring the cost of employee turnover in hourly jobs formula across quarters. Stores that operate with structured, clear audit routines retain their floor staff significantly longer because expectations remain consistent and measurable.
Inventory Accuracy, Receiving, and Backroom Flow
A disorganized backroom reflects poor operational discipline throughout the store. If receiving takes twenty-four hours to log a pallet into your enterprise resource planning system, your inventory counts remain inaccurate for that entire operational window.
I evaluate dock doors and processing areas on dock-to-stock velocity. Pallets sitting idle on a loading dock invite damage, theft, and inventory loss.
| Inventory Control | Standard Benchmark | Audit Method |
| Cycle Counting | ≥ 98% record accuracy across top SKUs | Daily rolling counts of high-shrink categories |
| Dock-to-Stock Speed | Inbound shipments receipted in < 4 hours | Timestamp verification from bill of lading to scan |
| RTV (Return to Vendor) | Damaged goods processed within 7 days | Physical audit of dedicated quarantine shelving |
| FIFO Rotation | Zero expired or aged batches on active display | Date-code inspection on rotating shelf displays |
Enforce strict First-In, First-Out (FIFO) procedures across all dated categories. Damaged goods must move to a secured Return to Vendor (RTV) area immediately rather than cluttering operational staging lanes.
Checkout Throughput and POS Reliability
The checkout area forms the final impression a shopper carries out the door. Long lines wipe out visual merchandising gains made on the sales floor.
Harvard Business Review has highlighted that perceived checkout friction directly influences customer churn and lifetime value. Modern retail requires sub-three-minute queue times during baseline traffic.
[Arrival at POS] ───► [Card / Tap Scan] ───► [Bagging & Receipt] ───► Target: < 180s
Queue Time
Audit your point-of-sale performance using these core checkpoints:
- Hardware Health: Test barcode scanners, receipt printers, and PIN pads daily before opening doors to eliminate transaction lag.
- Till Balancing: Enforce balanced drawer handovers with cash discrepancies kept strictly below three dollars per shift.
- Refund Friction: Keep returns under ninety seconds by equipping floor supervisors with mobile override credentials.
Facility Safety, Compliance, and Shrink Defense
Safety failures disrupt revenue faster than inventory mistakes. Non-compliance with standard workplace guidelines established by OSHA leads to costly citations and worker compensation claims that destroy store profitability.
Loss prevention must be integrated into daily routines rather than treated as a separate security concern. Audit your cameras for blind spots caused by seasonal banners or shifted gondolas.
Keep emergency egress routes, fire extinguishers, and electrical breaker panels clear of freight at all times. Verify that energy-management systems regulate heating, cooling, and display lighting automatically to prevent utility waste during non-operational hours.
The Root-Cause Scoring Framework (Audit Benchmark)
Standard pass/fail audits fail because they identify symptoms while ignoring underlying problems. When an operational item fails an inspection, categorize the issue using this root-cause scoring framework.
Using productivity metrics every operations manager should track can help managers quantify the impact of these operational weaknesses and prioritize corrective action.
| Finding Category | Diagnostic Definition | Corrective Mandate |
| Process Failure | Standard operating procedure is outdated or missing | Revise operational policy within 48 hours |
| Training Deficit | Associate unaware of correct operational execution | Mandatory peer retraining within 5 operational days |
| Systemic / Tool Breakdown | Defective equipment, network lag, or broken software | Escalate support ticket; bypass workflow temporarily |
Assign an operational score out of 100 for each department. Stores scoring below 85 require an operational re-audit within fourteen business days.
Stop Auditing Like It’s 1999: Your Next Operational Move
Clipboards belong in retail museums. If your team still conducts operational audits on paper sheets, transition to mobile audit software that logs photo evidence and assigns remediation tasks in real time.
Pick two low-scoring areas from this checklist and run a baseline evaluation tomorrow morning before unlocking your doors. Give your store leaders the tools to locate friction, resolve it, and convert wasted labor hours into profitable floor execution.
Frequently Asked Questions
1. How often should a retail store conduct an operational efficiency audit?
Run safety and POS checks daily, review stockrooms and merchandising weekly, and complete a full multi-point audit once a month.
2. What is the most critical metric in a retail operational audit?
Inventory record accuracy is paramount because corrupted stock data skews purchasing, fulfillment, and customer satisfaction simultaneously.
3. How does an operational audit reduce store shrinkage?
Audits identify CCTV blind spots, enforce disciplined receiving scans, and uncover phantom inventory before theft compounds.
4. Can small independent retailers use this audit structure effectively?
Yes, simply adapt the checkpoints to your footprint and focus primarily on POS reliability, shelf pricing, and backroom inventory counts.
Leave a Reply