Blog

  • Standard Operating Procedures Template for Shift Handovers: The Floor Manager’s Guide

    Standard Operating Procedures Template for Shift Handovers: The Floor Manager’s Guide

    I spent a decade running round-the-clock shift crews across heavy manufacturing lines. Early in my career, our plant lost an entire production run because an outgoing operator forgot to mention a recalibrated sensor. The incoming technician assumed standard baseline parameters. By 4:00 AM, thousands of gallons of product spoiled.

    That incident proved that verbal promises fail under fatigue. Every operational facility needs a battle-tested standard operating procedures template for shift handovers to eliminate communication gaps, preserve asset uptime, and protect employee safety.

    The Handover Cycle 
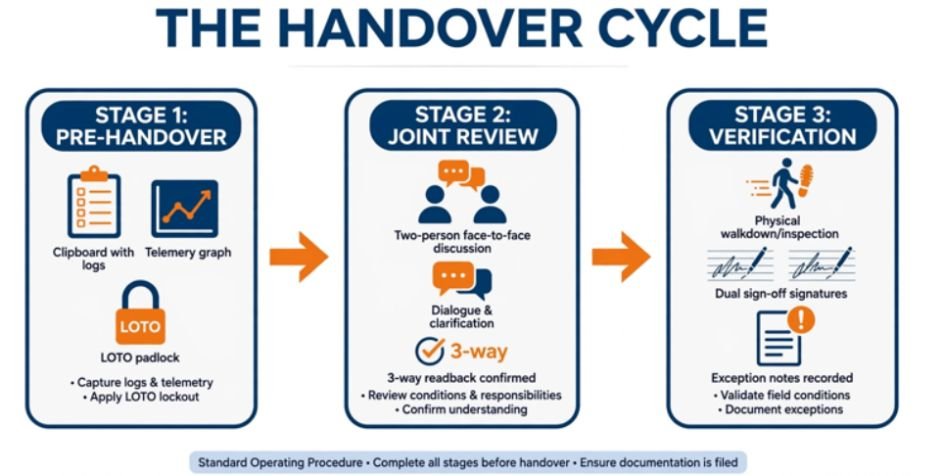
    The Handover Cycle

                                  THE HANDOVER CYCLE

       ┌───────────────────┐      ┌───────────────────┐      ┌───────────────────┐

       │   PRE-HANDOVER    │      │   JOINT REVIEW    │      │   VERIFICATION    │

       │  Outgoing logs    │ ───> │  Face-to-face     │ ───> │  Physical walk,   │

       │  telemetry, LOTO, │      │  3-way readback   │      │  dual sign-off,   │

       │  and open permits │      │  of active alerts │      │  exception notes  │

       └───────────────────┘      └───────────────────┘      └───────────────────┘

    The Shift Handoff Trap: Why Most SOPs Fail on the Floor

    Most facilities treat handovers like casual water-cooler conversations. Team members exchange a two-minute verbal recap, punch their cards, and leave.

    According to regulatory analyses from the HSE UK Guidance on Shift Handover Communication, communication breakdown during shift handovers remains one of the primary root causes of major industrial accidents. When fatigue sets in at the end of a twelve-hour shift, working memory drops sharply. People forget crucial operational details.

    If your team struggles with unscheduled departures, learning how to reduce absenteeism in shift work operations helps stabilize crew rotations so staff have predictable turnover schedules.

    The 3-Way Communication Rule
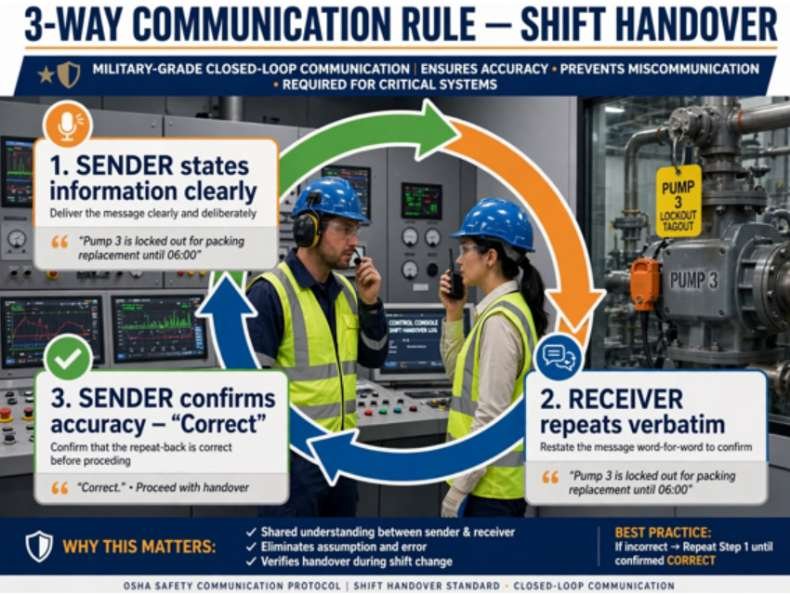
    The 3-Way Communication Rule

    To combat cognitive fatigue, adopt military-grade closed-loop communication:

    1. Sender states the information clearly (e.g., “Pump 3 is locked out for packing replacement until 06:00”).
    2. Receiver repeats the message verbatim (e.g., “Understood, Pump 3 is locked out for packing replacement until 06:00”).
    3. Sender confirms accuracy (“Correct”).

    NASA documents this exact protocol inside their NASA Human Systems Integration Guidelines to eliminate interpretation errors during critical system turnovers.

    The Master Standard Operating Procedures Template for Shift Handovers
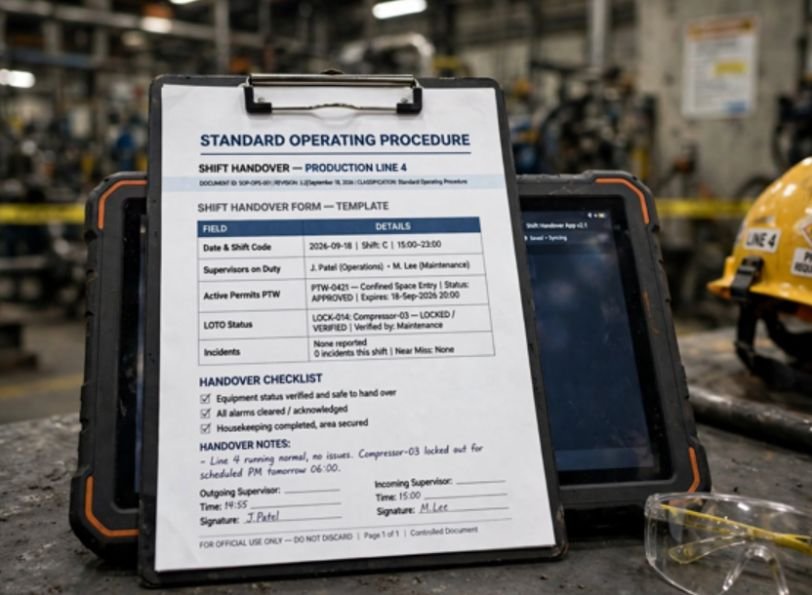
    The Master Standard Operating Procedures Template for Shift Handovers

    Below is the exact production-ready standard operating procedures template for shift handovers that you can adapt directly for your management system.

    DOCUMENT ID: SOP-OPS-001

    REVISION: 3.2

    EFFECTIVE DATE: September 18, 2026

    CLASSIFICATION: Standard Operating Procedure (Shift Transitions)

    Section 1: Administrative Scope & Responsibility

    • Purpose: Establish a standardized, zero-defect process for transferring operational control between crews.
    • Scope: Applies to all rotational operators, technicians, control-room engineers, and supervisors across all operating assets.
    • Compliance Baseline: Aligns with OSHA Process Safety Management Guidelines for mechanical integrity and operating procedures.
    Role Core Handover Duty Primary Deliverable
    Outgoing Crew Pre-compile operational logs, clean workstations, document alarms. Completed Digital/Physical Handover Log
    Incoming Crew Arrive 15 minutes early, review logbook, conduct physical inspection. Formal Acceptance Sign-Off
    Shift Supervisor Audit log completeness, arbitrate contested equipment statuses. Shift Transfer Endorsement

    Section 2: Step-by-Step Transition Workflow

    1. Pre-Handover Logging (T-Minus 15 Minutes): The outgoing lead enters all throughput numbers, downtime logs, and pending maintenance orders. Operators ensure station cleanliness and restock consumables.
    2. Face-to-Face Joint Review (T-Minus 5 Minutes): Outgoing and incoming leads meet at the primary control desk. Both teams execute closed-loop reviews on running jobs and active permits. 
    3. Physical Asset Walk (Transition T-Zero): Both leads walk active operating lines together to visually confirm lockouts, pressure gauges, and physical equipment stops.
    4. Conditional Sign-Off: Both leads sign the log. If the incoming lead spots an unrecorded problem, they check “Accepted with Exceptions” and call the supervisor.

    If your facility operates cross-departmental lines, evaluate our cross training employees benefit matrix to verify whether incoming operators hold active certifications on complex equipment before accepting transfers.

    Shift Handover Logbook Reference Tables

    Print or configure these reference tables directly into your computerized maintenance management system (CMMS) or station clipboards.

    When handover information needs to be accessed away from a central desk, teams can also use how mobile productivity apps increase efficiency for field staff to keep critical updates, task details, and operational notes accessible during transitions.

    Part A & B: Identity, Safety, and Compliance Log

    Field Outgoing Record Incoming Verification
    Date & Shift Code 2026-09-18 | Shift A (Day) 2026-09-18 | Shift B (Night)
    Supervisors on Duty Marcus Vance (Lead) Sarah Lin (Lead)
    Active Permits (PTW) #PTW-8821 (Hot Work Line 2) Inspected & Confirmed Open
    LOTO Status Breaker 4B Padlocked (Tag #104) Physical Padlock Verified
    Incidents / Near Misses 1 Near Miss (Conveyor Jam, 14:20) Log Reviewed & Countersigned

    Part C & D: Live System Metrics and Action Item Tracker

    Asset / Line ID Operating State Current Output / Variance Immediate Action for Incoming Crew
    Line 1 – Extruder Running 1,420 units/hr (-3% target) Monitor bearing temperature on roller 4.
    Line 2 – Packaging Down (Scheduled) 0 units/hr (LOTO Active) Vendor tech arrives at 19:30 for belt splice.
    Line 3 – Assembly Running 980 units/hr (+2% target) Clean output bin before midnight run.

    Hard Truths from 15 Years of Rotational Shifts

    Hard Truths from 15 Years of Rotational Shifts

    Most handovers fail for psychological reasons rather than technical ones. Outgoing operators want to pack up and get home. Incoming operators need their first cup of coffee and dislike hearing bad news before starting their shift.

    Here are three rules I enforce on every floor:

    • Never allow solo handovers: Both the outgoing and incoming operators must be standing at the console simultaneously. No passing notes left on clipboards.
    • The “Clean Station” metric is not aesthetic: A messy workstation hides leaking seals, worn parts, and missing tools. Messy stations indicate chaotic handoffs.
    • Empower incoming teams to reject handovers: If an incoming operator discovers an unlogged mechanical fault or an undocumented Lockout/Tagout, they refuse the handoff until the shift supervisor signs off.

    Frequently Asked Questions

    1. What should be included in a shift handover template?

    A complete template requires administrative shift details, open safety permits (LOTO), system performance metrics, pending maintenance actions, and dual sign-off signatures.

    2. How long should an effective shift handover take?

    A proper handover takes 10 to 15 minutes, divided into solo preparation, joint face-to-face review, and a physical station walkthrough.

    3. Can shift handovers be conducted completely digitally?

    Yes, provided the digital platform requires manual field acknowledgments, captures time-stamped signatures, and occurs alongside a verbal conversation.

    4. What is the biggest risk of a poor shift handover?

    Undetected safety hazards like active energy sources or improperly isolated valves represent the most dangerous risk of an incomplete shift transition.

    Stop Running Blind: Your Next Shift Starts Now

    Shift turnovers mark the single most vulnerable moment in 24-hour operations. When you rely on informal handoffs, you gamble with production quotas and employee safety.

    Take this standard operating procedures template for shift handovers, paste it into your plant documentation, and run an unannounced audit on your next midnight transition. You might be surprised by what your teams leave unsaid.


  • Labor Cost vs Productivity Formulas: What the Numbers Really Tell You

    Labor Cost vs Productivity Formulas: What the Numbers Really Tell You

    A worker’s hourly wage tells you far less about labor economics than many business spreadsheets suggest. In June 2026, private-industry employers paid an average of $46.89 per employee hour, while wages and salaries accounted for only $32.82. Benefits represented the remaining 30% of compensation costs.

    That gap is why labor cost vs productivity formulas are most useful when they measure the full cost of labor against actual output—not simply wages against hours.

    The formulas themselves are straightforward. The real skill lies in choosing the right output, including the right costs, and interpreting what changes from one period to another.

    The Three Numbers You Need Before Calculating Anything

    Start with three measurements for the same period: total labor hours, total labor cost, and output.

    Labor hours should normally mean actual hours worked. The Bureau of Labor Statistics’ productivity guidance notes that hours worked generally provide a more precise productivity measure than headcount because they account for differences such as full-time and part-time schedules.

    Total labor cost should extend beyond base wages. Depending on the analysis, it may include overtime, bonuses, paid leave, employer payroll taxes, health insurance, retirement contributions, workers’ compensation, and other benefits.

    That distinction matters in the U.S. because employers have federal employment-tax obligations in addition to wages. The IRS employment tax overview explains employer responsibilities for Social Security, Medicare, and federal unemployment taxes.

    Finally, define output in a way that reflects the operation. A factory might use finished units, a warehouse might use orders processed, a repair business might use completed jobs, and a professional-services firm might use billable work or another meaningful result.

    The Essential Labor Cost vs Productivity Formulas

    The Essential Labor Cost vs Productivity Formulas

    The core productivity calculation is:

    Labor Productivity = Total Output ÷ Total Labor Hours

    If a production team makes 15,000 units during 1,500 labor hours:

    15,000 ÷ 1,500 = 10 units per labor hour

    This tells managers how much output each hour of labor generated.

    For staffing comparisons, another version is:

    Output per Worker = Total Output ÷ Number of Workers

    That formula can be useful for broad workforce planning, but hours worked are usually better for operational analysis because two employees may have very different schedules.

    Here are the formulas that answer the most common business questions:

    Metric Formula What It Shows
    Labor productivity Output ÷ labor hours Output generated per hour
    Total labor cost Wages + overtime + benefits + employer taxes + other compensation Actual workforce expense
    Cost per labor hour Total labor cost ÷ labor hours True hourly labor cost
    Unit labor cost Total labor cost ÷ output Labor expense required per unit
    Labor efficiency Standard hours ÷ actual hours × 100 Performance against expected time
    Labor cost percentage Labor cost ÷ revenue × 100 Portion of revenue consumed by labor

    Among these, unit labor cost connects productivity and compensation most directly.

    The BLS explanation of unit labor cost defines it as labor compensation relative to output. It can also be expressed as hourly compensation divided by output per hour.

    In practical terms:

    Unit Labor Cost = Total Labor Cost ÷ Total Output

    A Realistic Example Shows Why Productivity Matters

    A Realistic Example Shows Why Productivity Matters

    Suppose a business produces 10,000 units using 1,000 labor hours.

    Its fully loaded labor expense is $48,000.

    Labor productivity:

    10,000 ÷ 1,000 = 10 units per hour

    Labor cost per hour:

    $48,000 ÷ 1,000 = $48 per hour

    Unit labor cost:

    $48,000 ÷ 10,000 = $4.80 per unit

    Now imagine process improvements allow the same workforce to average 11 units per hour while hourly labor cost remains unchanged.

    Producing 10,000 units would require about 909 hours instead of 1,000. Labor expense would fall to roughly $43,632, making labor cost approximately $4.36 per unit.

    Nothing about the hourly pay rate had to decrease. The economic improvement came from producing more in each labor hour.

    That relationship also appears in national data. Revised BLS figures for the second quarter of 2026 showed nonfarm business productivity increasing at a 1.4% annualized rate while hourly compensation increased 2.6%. Unit labor costs rose by a smaller 1.2%, demonstrating how productivity growth can offset part of an increase in compensation.

    The Federal Reserve Bank of St. Louis’ unit labor cost data similarly describes unit labor cost as the relationship between hourly compensation and productivity.

    How to Run the Calculation Without Misleading Yourself

    1. Pick a Consistent Measurement Period

    Compare output, hours, and labor expense from exactly the same week, month, quarter, or production cycle.

    Mixing monthly payroll costs with weekly production totals produces a meaningless ratio.

    2. Calculate Fully Loaded Labor Cost

    Avoid treating the hourly wage as the entire cost.

    Include compensation items relevant to your decision. BLS data showing benefits at 30% of private-industry compensation costs in June 2026 demonstrates how significantly wage-only calculations can understate workforce expense.

    3. Choose an Output Employees Can Actually Influence

    Units produced work well in manufacturing. Completed installations may work better for field services. Revenue can be useful in some businesses, but it can also rise because prices increased rather than because employees became more productive.

    For long-term comparisons, separating price changes from real output is particularly important.

    4. Calculate Productivity and Unit Cost Together

    A productivity number alone can hide rising labor expense. A labor-cost figure alone can make higher compensation look inefficient even when employees are creating substantially more output.

    Tracking both reveals whether the business is getting more economic value from each labor hour.

    5. Compare Trends, Not Isolated Numbers

    Measure the same formulas over several periods.

    Using workforce productivity tracking methods can help managers monitor these trends consistently and identify whether productivity is improving, stagnating, or declining over time.

    Look for situations such as productivity rising faster than labor cost, overtime increasing while output stays flat, or labor cost per unit climbing despite stable headcount.

    Those patterns are usually more actionable than one month’s ratio.

    Where Labor Efficiency Fits

    Where Labor Efficiency Fits

    Managers sometimes confuse labor productivity with labor efficiency.

    They answer different questions.

    How to handle peer conflict among frontline workers is also relevant when workflow problems or unclear responsibilities affect how efficiently teams complete their work.

    Productivity measures output per input. Efficiency compares actual time against an established standard:

    Labor Efficiency = Standard Labor Hours ÷ Actual Labor Hours × 100

    If a job is expected to require 80 hours but actually requires 100:

    80 ÷ 100 × 100 = 80% labor efficiency

    This can identify scheduling, training, equipment, workflow, or estimation problems. It should not automatically be interpreted as an employee performance score.

    Why Cutting Hours Is Not Automatically More Productive

    Lower labor cost can improve unit economics, but simply reducing staffing or demanding more output is not a productivity strategy.

    How to improve employee productivity in shift work is more about improving schedules, recovery time, workload design, and workflow efficiency than simply asking employees to produce more in fewer hours.

    Long hours may eventually work against the calculation.

    The Occupational Safety and Health Administration’s worker-fatigue guidance notes that extended and irregular work can contribute to lost productivity, injuries, illness-related absence, and other employer costs.

    Likewise, cost per unit needs context. Quality failures, rework, returns, safety incidents, and customer complaints can make apparently inexpensive production costly later.

    Research and guidance from Penn State Extension on workforce management also emphasizes looking beyond simple labor cost per productive unit and considering how employees’ roles and management affect workforce performance.

    Common Mistakes That Distort the Numbers

    One problem is counting revenue growth as productivity growth when higher prices created the increase. Another is comparing teams that perform substantially different work.

    Automation creates another complication. If output rises after a major equipment investment, labor productivity may increase even though workers themselves were not the only reason. BLS distinguishes labor productivity from multifactor productivity for exactly this reason: labor productivity compares output with labor input, while multifactor measures incorporate additional inputs such as capital, energy, materials, and purchased services.

    Managers should therefore treat labor cost vs productivity formulas as diagnostic measures, not complete explanations of business performance.

    Frequently Asked Questions

    1. What is the simplest labor productivity formula?

    Divide total output by total labor hours worked. For example, producing 8,000 units in 800 labor hours equals 10 units per labor hour.

    2. How do you calculate labor cost per unit?

    Divide total labor cost by the number of units produced. A $50,000 labor expense producing 10,000 units equals $5 of labor cost per unit.

    3. Should employee benefits be included in labor cost?

    Usually yes when calculating fully loaded labor expense. Include relevant employer-paid benefits, payroll taxes, overtime, bonuses, and other compensation to avoid understating workforce costs.

    4. Does higher productivity always mean lower labor costs?

    Not necessarily. Total labor spending can rise while productivity improves. What often matters more is whether labor cost per unit falls or output grows faster than compensation costs.

    The Number Worth Watching

    The most useful workforce metric is rarely the cheapest hourly wage. It is the amount of valuable output a business receives for what labor actually costs.

    That is why I would track productivity per hour and labor cost per unit side by side. If productivity rises faster than compensation, a business can pay workers more without experiencing the same increase in cost per unit. If unit labor cost rises while output stalls, the numbers point toward a problem worth investigating. The formulas are simple; choosing honest inputs and following the trend is what turns them into useful management information.

  • AI Tools for Reducing Manual Scheduling Work Without the Hassle

    AI Tools for Reducing Manual Scheduling Work Without the Hassle

    I noticed how quickly a scheduling task can turn into a string of small decisions. Checking availability, moving a meeting, finding coverage, and remembering deadlines may each take only a few minutes, but repeated across a week, they create a surprising amount of administrative work.

    I also realized that the real frustration is rarely the calendar itself. It is the constant coordination around it. When priorities change or someone becomes unavailable, a schedule that looked workable in the morning can need rebuilding by lunch. That is where AI tools for reducing manual scheduling work can become useful.

    Why Manual Scheduling Becomes Such a Time Drain

    Manual scheduling looks straightforward until several constraints collide. A manager may need to consider employee availability, time off, shift coverage, qualifications, workload, deadlines, labor budgets, and existing meetings at the same time. One change can affect several other assignments.

    The repetitive part is often the biggest burden. A manager might compare calendars, message employees, fill open shifts, check conflicts, and rebuild schedules after an absence. Those tasks may not require deep strategic judgment, yet they consume attention that could go toward customers, employees, or operations.

    What AI Scheduling Tools Actually Automate

    What AI Scheduling Tools Actually Automate

    AI scheduling software can take over much of that coordination by working with calendar information, tasks, employee preferences, availability, and scheduling rules. Instead of starting with an empty calendar, a user can provide priorities and constraints while the system generates a workable schedule.

    The level of automation varies. Some tools focus on personal calendars, while others handle employee shifts, demand forecasts, skills, and workforce rules. The useful question is what scheduling work a platform can actually remove.

    Matching People to the Right Shifts

    For workforce scheduling, AI can compare several factors at once. Availability can be checked against staffing needs, while skills or qualifications can help determine who is suitable for a particular shift. Employee preferences can also be incorporated where supported.

    This reduces the tedious process of opening multiple calendars or spreadsheets and manually comparing options. It can also help identify gaps before a schedule is published, giving managers time to address coverage problems.

    Responding When Plans Change

    Scheduling rarely stays fixed. Employees call out, meetings run late, priorities move, and demand changes. A useful scheduling system should therefore do more than create a schedule once.

    Some AI planners can automatically rearrange flexible tasks when fixed events move. Workforce systems can similarly help managers adjust staffing when availability or demand changes. The benefit is fewer rounds of manual dragging, deleting, and rebuilding.

    Where AI Can Make Scheduling More Efficient

    Demand forecasting is one area where AI can add another layer of usefulness. Historical patterns and business data can help estimate when more or fewer employees may be needed. That information can support staffing decisions rather than leaving managers to rely entirely on intuition.

    AI can also help surface scheduling conflicts, overtime risks, uncovered shifts, and other issues before they become operational problems. Integrations with time tracking, payroll, HR, and other business systems can further reduce duplicate data entry.

    The result is not necessarily a completely hands-off workplace. It is a shift in where human attention is spent. Instead of repeatedly constructing the schedule, managers can review exceptions and solve unusual problems.

    AI Still Needs Human Oversight

    AI Still Needs Human Oversight

    Automation works best when the system has accurate information and clear rules. If employee availability is outdated, a qualification is missing, or a manager has knowledge that never reached the platform, an automatically generated schedule can still be unsuitable.

    Human review remains valuable. Managers can check whether a proposed schedule makes sense operationally, whether workloads are reasonable, and whether a particular employee or customer situation requires special consideration. Current AI scheduling products commonly position generated schedules as recommendations that users can review and adjust.

    Choosing the Right Approach for Your Team

    The right solution depends on the type of scheduling work creating the most friction. A small team may need simple calendar automation, while a larger operation may need demand forecasting, skills matching, compliance features, and integrations.

    Look at how much control the system provides, how easily employees can update their information, and whether it connects with tools already used by the business. Data quality matters too. AI cannot make reliable recommendations from incomplete or outdated workforce information.

    For organizations exploring AI employee scheduling tools for modern businesses, the most useful starting point is often the repetitive task causing the biggest bottleneck. Identify that task first, then look for technology that solves it without unnecessary complexity.

    The Habits Worth Changing

    The biggest benefit of scheduling automation may be the steady reduction of small administrative tasks that interrupt the working day. When routine coordination is handled automatically, managers can review schedules with a clearer picture of priorities instead of rebuilding the same information.

    Good AI scheduling should make the process feel lighter, not more complicated. The technology works best when it handles repetition while people retain the judgment, context, and responsibility behind the schedule.

    FAQs: AI Tools for Reducing Manual Scheduling Work Without the Hassle

    1. What can AI scheduling tools automate?

    They can automate creating schedules, checking availability, matching people to shifts, protecting calendar blocks, identifying conflicts, and adjusting flexible plans when circumstances change.

    2. Can AI replace a scheduling manager?

    Usually, AI is better viewed as a support system than a replacement. Managers still need to review recommendations, handle exceptions, and account for information the software may not understand.

    3. Is AI scheduling useful for small businesses?

    Yes. Teams can use automation to reduce repetitive calendar coordination, shift planning, availability checks, and last-minute schedule adjustments without needing a large workforce management system.

    4. What should businesses check before choosing a tool?

    Consider integrations, scheduling rules, employee access, data accuracy, reporting, scalability, and how much control managers retain over AI-generated recommendations.

    Making Scheduling Feel Manageable Again

    Scheduling is one of those operational jobs that can quietly consume hours because its individual tasks seem too small to prioritize. Automating those repeated decisions can create breathing room, particularly when a team has frequent changes, multiple constraints, or a growing workforce. The goal is not to remove people from the process. It is to remove unnecessary repetition from their workload.

    When the routine gets easier, the people managing the schedule can focus on the decisions that actually deserve their time.

  • Cross Training Employees Benefit Matrix for Small Business

    Cross Training Employees Benefit Matrix for Small Business

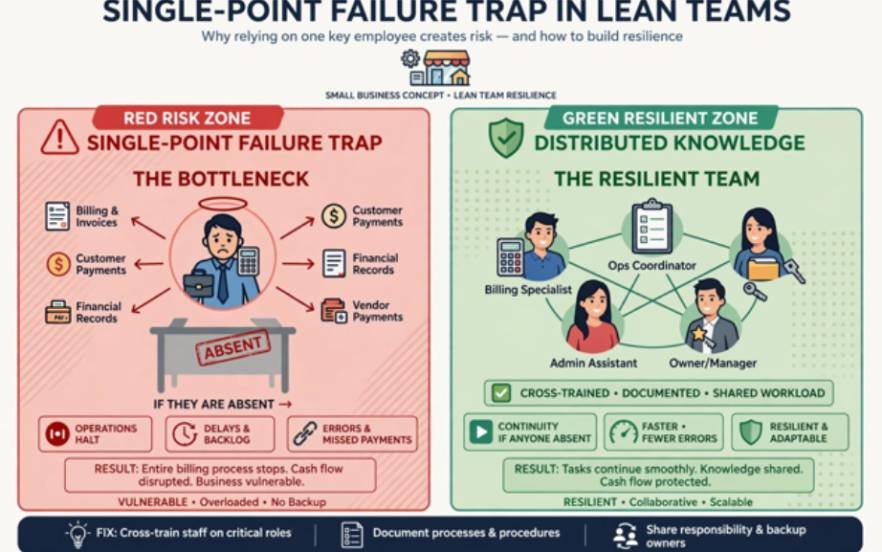
    A single key employee calling in sick can bring a lean enterprise to a complete halt. I learned this the hard way when our sole billing specialist took medical leave, stalling our accounts receivable for three straight weeks. Designing a cross training employees benefit matrix for small business operations became our survival mechanism. By mapping capabilities against operational vulnerabilities, small teams build resilience without inflating payroll costs.

    The Single-Point Failure Trap in Lean Teams

    The Single-Point Failure Trap in Lean Teams

    Running a business with five to twenty employees often creates accidental knowledge silos. When only one team member knows how to generate shipping labels or run client onboarding, that person becomes a structural bottleneck. Conducting an operational efficiency audit reveals these hidden vulnerabilities before an emergency forces your hand.

    According to workforce continuity research by the U.S. Small Business Administration, operational redundancies separate agile small firms from those that shutter during localized disruptions. Cross-training distributes specialized know-how across functional teams, converting fragile dependencies into interchangeable capabilities.

    Mapping Core Functions to High-Yield Outcomes

    Mapping Core Functions to High-Yield Outcomes

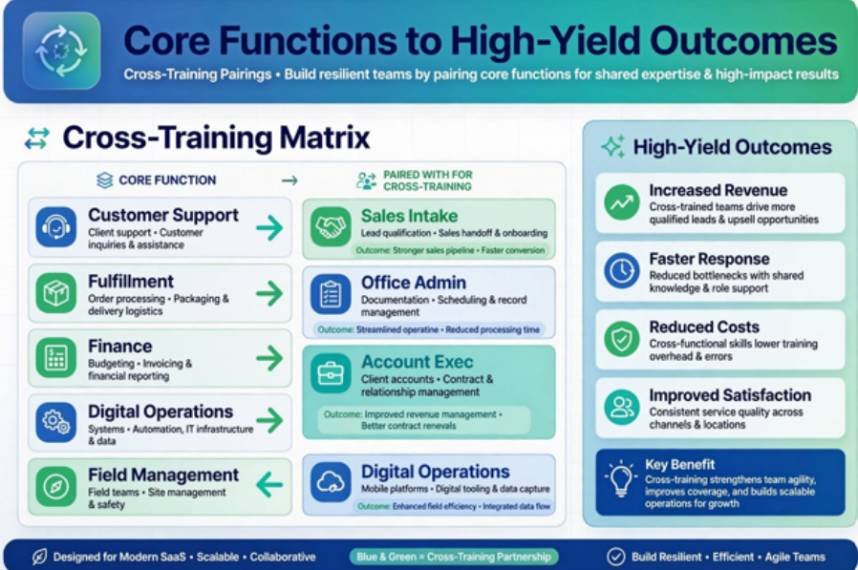
    Cross-training creates measurable business upside across daily operational tracks. The table below illustrates how pairing specific roles protects bottom-line continuity.

    Core Business Function Cross-Trained Role Pair Target Competency / Task Direct Business Benefit
    Customer Support Support Rep ➔ Sales Intake CRM lead qualification & logging Zero missed leads during call spikes
    Fulfillment Office Admin ➔ Shipping/Inventory Label generation & stock counts Order continuity during peak volume
    Finance & Admin Account Exec ➔ Invoicing Basics Creating invoices & Net-30 follow-up Steady cash flow during bookkeeper leave
    Digital Operations Social Lead ➔ Basic CMS Updates Content publishing & minor copy edits Eliminates costly agency retainers
    Field Management Shift Lead ➔ Payroll Verification Timecard audits & daily checklists Protects owner bandwidth for growth

    Cross-skilling frontline staff also helps reduce absenteeism in shift work operations by giving workers variety and coverage flexibility when emergencies arise.

    The Strategic Skills Matrix: Levels 0 Through 3

    The Strategic Skills Matrix Levels 0 Through 3

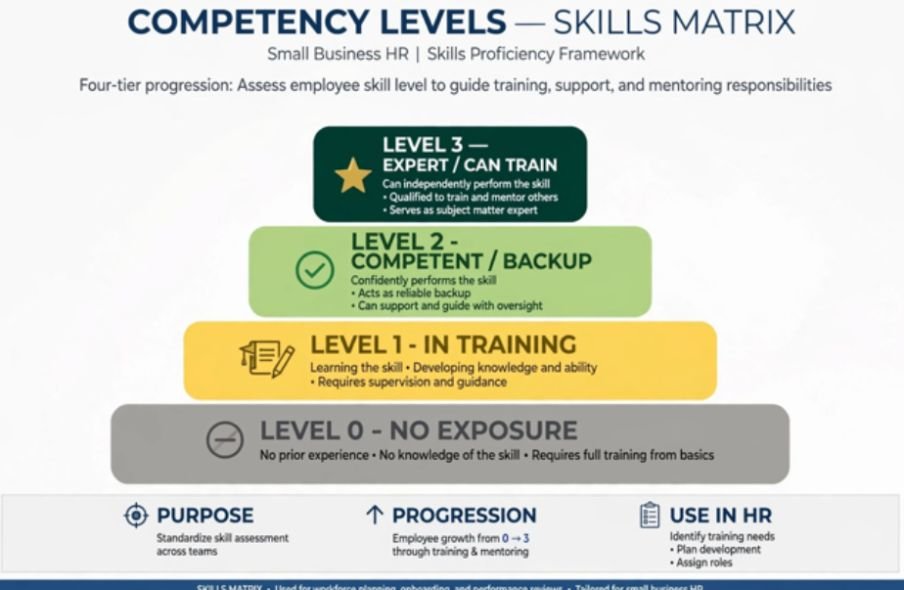
    A benefit matrix works only when paired with an honest assessment of current staff capabilities. I use a four-tier tracking grid to monitor team coverage across mission-critical duties.

    Competency Levels:

    [Level 3: Expert / Can Train]  ➔  Fully autonomous; mentors others

    [Level 2: Competent Backup]    ➔  Executes reliably during absence

    [Level 1: In Training]         ➔  Understands basics; requires guidance

    [Level 0: No Exposure]         ➔  Unassigned; zero system access

    Data from the Society for Human Resource Management indicates that organizations mapping multi-role proficiencies experience significantly lower turnover. Tracking proficiencies visibly helps managers deploy talent strategically.

    Competency Tiers That Prevent Operational Chaos

    Evaluating employees using this framework highlights single-operator risks immediately.

    Employee Name Task A: Billing Run Task B: Site Maintenance Task C: Inventory Intake
    Marcus Vance Level 3 (Primary) Level 0 Level 2 (Backup)
    Elena Rostova Level 2 (Backup) Level 3 (Primary) Level 0
    David Chen Level 1 (Trainee) Level 0 Level 3 (Primary)

    If Marcus takes unexpected leave, Elena steps in seamlessly at Level 2 competency. Cash flow continues uninterrupted.

    The 90-Day Rollout Playbook for Lean Operations

    The 90-Day Rollout Playbook for Lean Operations

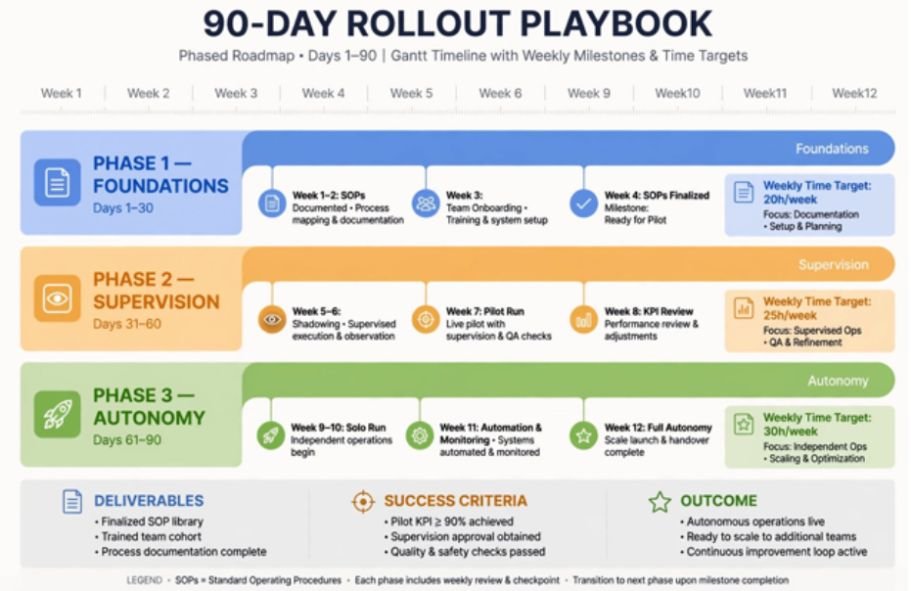
    Phase Window Weekly Time Target Tangible Milestone Output
    Phase 1: Foundations Days 1–30 1–2 hours / week Validated 1-page SOPs & 1-on-1 capacity buy-in
    Phase 2: Supervision Days 31–60 2–3 hours / week Completed shadowing & verified software logins
    Phase 3: Autonomy Days 61–90 1–2 hours / week First solo production run & maintenance cadence

    Rolling out cross-skilling without a phased schedule overwhelms daily operational capacity. I rely on a structured 90-day cycle to introduce new proficiencies gradually.

    Understanding the impact of predictable scheduling on overall workplace productivity can also help managers create consistent training windows without disrupting daily operations.

    Peer-reviewed analysis published in the Harvard Business Review highlights that cross-functional development improves retention when businesses provide designated learning windows during normal working hours.

    Mitigating Skill Dilution and Staff Resentment

    Cross-skilling initiatives fail when leadership ignores human factors. Two primary friction points require proactive mitigation:

    1. Compensation Friction: Workers often interpret cross-training as unpaid workload inflation. Anchor cross-training to professional growth paths, skill-tier bonuses, or merit reviews. Workplace research by Gallup links internal upskilling directly to increased employee engagement when paired with recognition.
    2. Skill Atrophy: A backup who handles a task once a year forgets the steps. Schedule recurring half-day rotations every month so backup operators maintain active operational memory.

    Frequently Asked Questions

    1. How does a skills matrix differ from a job description?

    A job description lists hiring requirements, whereas a skills matrix tracks dynamic real-time capabilities across a functioning team.

    2. How many backup operators should a small business train per task?

    Every mission-critical operational task requires at least one Level 2 backup operator alongside the primary owner.

    3. What is the best way to prevent employee burnout during cross-training?

    Cap weekly training hours at 10% of total working time and schedule sessions during historical low-volume periods.

    4. Can small businesses run cross-training without enterprise HR software?

    A cloud-hosted spreadsheet tracking standard Level 0 through Level 3 metrics provides sufficient functional visibility.

    Stop Running on Operational Thin Ice

    Building operational redundancy is not an expensive luxury reserved for large enterprises. Run a quick capability audit across your primary processes this week, pinpoint your solo dependencies, and assign your first Level 1 cross-training pair.

  • How to Create a Positive Workplace Culture That Lasts

    How to Create a Positive Workplace Culture That Lasts

    I have seen organizations spend heavily on benefits, social events, and stylish offices while overlooking the daily experiences that truly shape their culture. Employees judge a workplace by how leaders communicate, whether managers behave fairly, and whether people feel safe expressing concerns. Learning how to create a positive workplace culture therefore begins with improving everyday behavior—not introducing superficial perks.

    A healthy culture cannot be built through one policy or motivational speech. It develops when values, leadership decisions, employee experiences, and workplace systems consistently support one another.

    What Is a Positive Workplace Culture?

    A positive workplace culture is an environment where employees feel respected, supported, included, and connected to a shared purpose. People understand what is expected of them, have the resources required to succeed, and trust that leaders will treat them fairly.

    This does not mean everyone must always agree or remain cheerful. Healthy workplaces still experience pressure, mistakes, and disagreements. The difference is that employees can discuss problems honestly, learn from failures, and resolve conflict without humiliation, retaliation, or unnecessary fear.

    Why a Healthy Workplace Culture Matters

    Culture influences how employees communicate, make decisions, serve customers, and respond to change. When people feel valued and psychologically safe, they are more willing to contribute ideas, ask for assistance, and accept responsibility.

    A strong culture can also improve retention. Employees are less likely to search for another job when they trust their managers, see opportunities for development, and believe their work matters. Organizations benefit through lower recruitment costs, better teamwork, stronger productivity, and a more attractive employer reputation.

    Assess the Existing Employee Experience

    Assess the Existing Employee Experience

    Before changing workplace culture, leaders need an honest understanding of current conditions. Employee surveys, confidential exit interviews, small-group discussions, exit interviews, absenteeism records, and turnover data can expose patterns that senior leaders may not see.

    Questions should examine trust, workload, recognition, fairness, communication, inclusion, development, and manager effectiveness. Leaders must then share the main findings and explain what will change. Asking for feedback without acting on it can weaken trust rather than strengthen it.

    Define Values as Observable Behaviors

    Words such as integrity, respect, and teamwork sound impressive, but employees need to understand what those values look like in practice. Respect could mean listening without interrupting, responding to messages within an agreed period, and challenging ideas without attacking people.

    Each value should be connected to several observable behaviors. Those behaviors must guide hiring, onboarding, performance reviews, promotions, recognition, and disciplinary decisions. When high-performing employees are allowed to ignore the standards, the stated values quickly lose credibility.

    Require Leaders to Model the Culture

    Employees pay closer attention to leadership behavior than corporate statements. A manager who requests honest feedback but becomes defensive when challenged teaches employees to remain silent.

    Leaders should admit mistakes, explain important decisions, keep reasonable promises, and apply rules consistently. They also need training in coaching, conflict resolution, inclusive communication, and performance management. Technical expertise alone does not prepare someone to lead people effectively.

    Create Psychological Safety

    Psychological safety allows employees to raise concerns, offer different opinions, and acknowledge mistakes without expecting embarrassment or retaliation.

    Learning how to create psychological safety at work can help leaders build an environment where employees feel comfortable speaking up, sharing ideas, and discussing problems.

    Leaders can strengthen it by inviting questions, responding calmly to criticism, and treating reasonable failures as opportunities to learn.

    Employees also need reliable reporting options for bullying, harassment, discrimination, and unethical conduct. Complaints should be handled confidentially, promptly, and consistently. A respectful environment depends on accountability as much as encouragement.

    Make Communication Predictable

    Make Communication Predictable

    Uncertainty encourages rumors and mistrust. Organizations should establish dependable communication routines, such as team meetings, individual check-ins, written updates, and opportunities to question senior leaders.

    Transparent communication does not require disclosing every confidential detail. It means sharing what can be shared, explaining why some information is restricted, and avoiding misleading promises. Remote, frontline, part-time, and shift-based employees should receive the same essential information as office teams.

    Recognize Meaningful Contributions

    Recognition helps employees understand which efforts and behaviors matter.

    Learning how to improve employee morale at work can help leaders use recognition, feedback, and supportive practices to strengthen employees’ overall workplace experience.

    Effective appreciation is timely, specific, fair, and connected to genuine contributions. A manager should explain what the employee did, why it helped, and how it supported the team or organization.

    Recognition can include private thanks, public acknowledgement, development opportunities, additional responsibility, or appropriate rewards. Leaders should learn how individuals prefer to be recognized because public praise may motivate one employee and embarrass another.

    Support Growth and Internal Opportunity

    Employees are more invested when they can see a future within the organization.

    Effective employee cross-training can give employees opportunities to develop new skills, understand different roles, and take on broader responsibilities.

    Managers should discuss career goals, provide constructive feedback, and offer access to training, mentoring, job shadowing, and stretch assignments.

    Development opportunities must be distributed fairly. If the same visible employees receive every important assignment, others may conclude that progression depends on favoritism rather than ability.

    Protect Well-Being and Work-Life Boundaries

    A workplace cannot claim to value well-being while rewarding constant availability and excessive workloads. Leaders should examine staffing levels, deadlines, meeting habits, break practices, and after-hours communication.

    Flexibility can help, but it should not replace manageable workloads. Managers must notice signs of burnout, discuss task priorities, and remove unnecessary work where possible. Supporting well-being means improving how work is designed, not placing the entire responsibility on employees.

    Build Inclusion Into Daily Operations

    Build Inclusion Into Daily Operations

    Inclusion means people have meaningful access to information, opportunities, decision-making, and recognition. Employers should examine whether meetings, promotions, workplace technology, social activities, and benefits unintentionally exclude particular groups.

    Recruiting for “culture add” can be more useful than hiring for “culture fit.” Candidates can share the organization’s essential values while bringing different experiences, perspectives, and approaches that help the culture evolve.

    Measure Culture and Maintain Accountability

    Culture should be measured through a combination of employee feedback and operational evidence. Useful indicators include voluntary turnover, regrettable turnover, absenteeism, internal promotions, survey participation, recognition frequency, psychological-safety scores, and complaint-resolution times.

    Leaders should select a small group of meaningful measures, establish a baseline, and review progress regularly. Results should be divided by team or employee group where appropriate because an organization-wide average can conceal serious local problems.

    A Practical 90-Day Improvement Approach

    During the first 30 days, gather employee feedback, review workforce data, and identify the behaviors creating the greatest harm. During the next 30 days, define expected behaviors, train managers, and address one or two high-impact concerns.

    In the final 30 days, introduce communication and recognition routines, assign responsibility for each initiative, and publish an update explaining the progress made. Culture improvement should then continue through regular reviews rather than ending after one campaign.

    Frequently Asked Questions

    1. Why does workplace culture usually fail to improve?

    Improvement often fails when leaders introduce slogans without changing management behavior, workloads, rewards, promotions, or accountability.

    2. How long does cultural change take?

    Small improvements may appear within weeks, but lasting change generally requires months of consistent leadership behavior and system-level reinforcement.

    3. Who is responsible for workplace culture?

    Senior leaders establish priorities, managers shape daily experiences, and employees influence team behavior. However, leaders hold the greatest responsibility because they control policies, resources, and consequences.

    4. How to create a positive workplace culture in a small organization?

    Begin with clear expectations, regular conversations, fair recognition, manageable workloads, and prompt action when harmful behavior occurs. Small organizations can improve quickly because communication channels are shorter.

    Moving Forward

    I believe the most reliable culture strategy is also the simplest: make every workplace decision consistent with the experience the organization promises its employees. Leaders should listen carefully, act visibly, measure honestly, and correct behavior that contradicts shared values.

    A positive culture is never permanently completed. It is maintained through thousands of decisions about communication, opportunity, workload, recognition, and accountability. When those decisions repeatedly demonstrate respect and fairness, employees do not merely hear the organization’s values—they experience them.

  • Workforce Productivity Tracking Methods That Reveal Real Performance

    Workforce Productivity Tracking Methods That Reveal Real Performance

    A productivity dashboard can look precise while measuring the wrong thing. An employee may log eight active hours and still finish little meaningful work. Useful workforce productivity tracking methods therefore begin with one question: what valuable result is this role supposed to produce?

    The U.S. Bureau of Labor Statistics productivity program measures labor productivity as output relative to hours worked. In the second quarter of 2026, U.S. nonfarm business labor productivity rose 1.4% as output increased 1.7% and hours worked rose 0.3%. Productivity is ultimately about the relationship between effort and results.

    Start With Output, Not Visible Activity

    Tracking should begin with the unit of value a team creates: resolved support cases, qualified pipeline, revenue, or completed orders with low error rates. KPIs and OKRs work because they judge whether work advances business goals without assuming visible activity equals contribution.

    A practical formula is:

    Productivity rate = useful output ÷ labor input

    Labor input may be hours, shifts, full-time equivalents, or labor cost. “Useful output” must fit the job. Measuring developers only by tickets closed may reward small tasks while undervaluing difficult debugging.

    Five Workforce Productivity Tracking Methods Worth Using

    1. Outcome and Goal Completion

    Measure completed goals, revenue, cases resolved, units produced, projects shipped, or milestones reached.

    In hospitality, these measures can also help teams assess how to manage seasonal demand fluctuations in hospitality by comparing staffing levels and service output across changing demand periods.

    This works well for knowledge work because it focuses on results rather than digital presence. Use it when employees have clear deliverables and reasonable control over results.

    2. Time and Task Tracking

    Time tracking shows where labor is going in project-based work. Its best use is diagnostic: if a team spends 30% of its week on low-value administration, that is a process problem. Recorded time alone does not prove useful output.

    Time data becomes especially valuable when managers compare it with project completion, labor cost, or customer outcomes rather than judging hours in isolation.

    3. Quality-Adjusted Output

    3 Quality-Adjusted Output

    Volume without quality invites shortcuts. Pair throughput with error rates, rework, returns, first-contact resolution, defect rates, customer satisfaction, or audit accuracy.

    A team processing more orders while producing many more errors may not be more productive. Quality-adjusted measures expose that trade-off.

    4. Focus Time and Workflow Friction

    Calendar and collaboration data can reveal meeting overload, task switching, and too little uninterrupted work time. Use this mainly at team level to find process problems, not punish short inactive periods.

    Long approval chains, repeated handoffs, and unnecessary meetings may explain declining output more accurately than an individual employee’s activity level.

    5. Application and Process Analytics

    Software and process data can show which tools employees rely on and where work stalls.

    Managers can also review productivity metrics every operations manager should track to identify meaningful workflow patterns without relying too heavily on individual activity levels.

    The signal weakens when apps are labeled “productive” or “unproductive.” A browser may contain research, customer work, training, or distraction.

    Method Best signal Useful for Main risk
    Outcome tracking Goals and results Knowledge work, sales Ignoring outside factors
    Time/task tracking Labor allocation Billing and capacity Confusing time with value
    Quality metrics Accuracy and impact Service and operations Overweighting one score
    Focus analysis Workflow friction Office and hybrid teams Micromanagement
    App/process analytics Workflow patterns Digital work Surveillance

    Build a Balanced Productivity Scorecard

    Build a Balanced Productivity Scorecard

    A single metric is easy to game. A stronger system combines output, quality, and sustainability. A support team could weight cases resolved at 50%, customer satisfaction and reopen rates at 30%, and backlog reduction at 20%. The exact weights should reflect business priorities rather than what software happens to measure easily.

    Before adopting a metric, use this five-question test:

    1. Does it measure something the employee can reasonably influence?
    2. Could someone improve the number while making the real outcome worse?
    3. Does it capture quality as well as speed?
    4. Do employees know what is measured and how it is used?
    5. Would the metric still seem fair in a promotion or performance review?

    Any “no” is a reason to redesign the measure before attaching consequences to it.

    Why Surveillance Can Distort Productivity Data

    Digital monitoring can collect keystrokes, screenshots, location, application use, audio, video, and other behavioral data. These tools can create operational insight, but also a false sense of precision.

    A 2025 U.S. Government Accountability Office review of digital workplace surveillance drew on 122 studies plus stakeholder interviews. GAO found that digital surveillance may help operations in some situations, but flawed benchmarks can miss parts of a worker’s responsibilities.

    Overtime productivity decline studies provide another example of why hours worked should be evaluated alongside actual output, quality, and fatigue rather than treated as a direct measure of productivity.

    The reviewed evidence also identified possible effects including stress, anxiety, and inaccurate performance evaluations.

    The American Psychological Association’s research on electronic monitoring reported that 51% of workers in its 2023 Work in America survey were aware their employer monitored them electronically. Among monitored workers, 56% said they typically felt tense or stressed at work.

    Collect data for a legitimate purpose, and avoid turning behavioral proxies into automatic judgments.

    Make Tracking Fair, Transparent, and Job-Specific

    Make Tracking Fair, Transparent, and Job-Specific

    The U.S. Equal Employment Opportunity Commission’s workplace guidance gives a useful example: a worker with a visual disability who uses voice recognition software could be unfairly scored by an algorithm that treats keystrokes as productivity. The EEOC notes that alternative measures may be necessary to assess actual performance accurately.

    Metrics must be valid for the way a job can actually be performed.

    Employers should document each metric, its purpose, data source, review frequency, and owner. Employees should know whether data is used for coaching, capacity planning, pay, promotion, safety, or discipline.

    The NIOSH guidance on fatigue and work notes that fatigue can reduce attention, short-term memory, reaction time, and judgment. If a productivity target encourages skipped breaks, chronic overtime, or an unsafe pace, the measurement system may undermine the performance it is supposed to improve.

    What Not to Measure Too Literally

    Keyboard activity, green-status time, emails sent, meetings attended, and hours online are easy to count. For many roles, they are weak performance measures.

    They may help diagnose workflow issues, but they should rarely stand alone in evaluations. The closer a measure gets to compensation, discipline, or promotion, the more directly it should connect to job outcomes.

    The best workforce productivity tracking methods use activity data as context, not as the verdict.

    Frequently Asked Questions

    1. What is the best way to track workforce productivity?

    Use a balanced set of outcome, quality, and labor-input measures. Match the mix to the role and avoid relying on a single activity metric.

    2. Should employers track employee computer activity?

    Only for a clear business purpose. Workflow data can reveal bottlenecks, but constant individual surveillance can create privacy, trust, and accuracy problems.

    3. How often should productivity metrics be reviewed?

    Operational metrics may be checked weekly, while strategic trends often make more sense monthly or quarterly. Match the cadence to how quickly meaningful performance can change.

    4. What metrics work well for remote employees?

    Use deliverables, milestones, quality, customer outcomes, response standards, and team commitments. Avoid defining productivity mainly through online status or keyboard activity.

    A Better Way to Think About Productivity

    The most important number on a productivity dashboard is not always the easiest one to collect. Strong measurement starts with valuable output, checks its quality, and asks what labor and work conditions were required to produce it.

    That gives managers more than a record of who looked busy. It reveals where capacity is constrained, where processes fail, and where teams create real value. If a metric cannot improve a decision, remove a bottleneck, or clarify performance, it probably does not deserve a place on the dashboard.

  • How to Motivate Disengaged Employees Before They Give Up

    How to Motivate Disengaged Employees Before They Give Up

    I have learned that workplace disengagement rarely appears overnight. It often begins quietly: an enthusiastic employee stops sharing ideas, takes longer to finish assignments, avoids team discussions, or no longer shows interest in progressing. 

    It is tempting to label that person as lazy, but doing so can overlook problems involving workload, recognition, leadership, trust, or job design. Understanding how to motivate disengaged employees starts with identifying what changed before trying to push performance higher.

    Recognize the Signs Without Making Assumptions

    A disengaged employee may become quieter during meetings, stop volunteering, miss deadlines, produce inconsistent work, take additional absences, or show little interest in feedback. Other employees may continue meeting minimum expectations while emotionally withdrawing from the organization.

    One sign alone does not prove disengagement. A previously dependable employee might be experiencing a temporary personal difficulty, unclear instructions, insufficient training, burnout, or a health concern. Managers should focus on observable changes instead of diagnosing attitudes or making assumptions about private circumstances.

    For example, “Your last three reports arrived after the agreed deadline” is specific and fair. “You no longer care about your job” is an unsupported judgment that may make an honest conversation more difficult.

    Find the Root Cause of Disengagement

    Find the Root Cause of Disengagement

    Different causes demand different responses. An employee overwhelmed by an unreasonable workload will not benefit from another incentive.

    Unpredictable scheduling can also contribute to disengagement, particularly when frequent shift changes or swaps disrupt an employee’s routine and productivity; understanding how to manage shift-swap productivity loss can help managers address this type of operational issue.

    Someone bored by repetitive assignments may not need time off; that person may need greater responsibility or a new challenge.

    Common causes include poor communication, unclear priorities, limited autonomy, weak recognition, unfair treatment, stagnant pay, excessive workloads, few development opportunities, conflict with coworkers, and a lack of connection between daily tasks and organizational goals.

    Managers should also examine their own behavior. When several team members withdraw at approximately the same time, the problem may involve leadership practices, organizational change, inconsistent expectations, or a damaged workplace culture rather than several unrelated attitude problems.

    Begin With a Private and Respectful Conversation

    The first conversation should take place privately and focus on curiosity rather than blame. Begin by describing the work-related changes you have observed and explaining why you are concerned.

    A manager might say: “I’ve noticed that you have contributed less during our recent planning meetings and that two assignments were delayed. That is different from your usual work. I wanted to check in and understand what may be getting in your way.”

    Useful questions include:

    • What part of your work currently feels most frustrating?
    • Are your priorities and responsibilities clear?
    • Do you have the tools and authority needed to succeed?
    • Which assignments make the best use of your abilities?
    • What is one change that would help you perform more effectively?

    Listen without immediately defending company policies or offering solutions. Employees are more likely to describe the real problem when they believe their manager genuinely wants to understand it.

    Match the Solution to the Actual Problem

    Once the cause becomes clearer, choose a targeted response. Clarify priorities when expectations are confusing. Provide coaching when an employee lacks a skill. Rebalance assignments when workloads are unsustainable.

    When motivation problems are connected to ongoing performance issues, managers can also use a structured approach to manage underperforming employees while providing clear expectations, targeted support, and regular follow-up.

    Introduce challenging projects when boredom is responsible. Address conflict directly when a damaged working relationship is affecting motivation.

    Recognition should also be personal and specific. Instead of saying, “Good job,” explain what the employee did and why it mattered. Timely recognition shows that useful contributions are noticed, but it should never be used to disguise low pay, unfair workloads, or unresolved management problems.

    Restore Autonomy and Meaning

    Restore Autonomy and Meaning

    Micromanagement can intensify disengagement because it removes ownership from the employee. Managers should define the required outcome, boundaries, deadline, and available resources, then allow reasonable freedom in how the work is completed.

    Giving employees greater consistency in their schedules can also support a more stable work experience, making the impact of predictable scheduling on overall workplace productivity relevant when managers are looking for ways to improve engagement and performance.

    Employees also need to understand how their responsibilities contribute to customers, coworkers, or organizational results. A routine report becomes more meaningful when the employee knows it helps prevent costly errors or supports an important decision.

    Autonomy does not mean removing accountability. Employees still need clear standards, progress reviews, and support. The goal is to provide control within well-defined expectations.

    Create a 30-Day Re-Engagement Plan

    Turn the conversation into a short written plan with two or three realistic goals. Record what the employee will do, what the manager will provide, and when progress will be reviewed.

    For example, the employee may agree to complete weekly priorities by Friday, participate in one planning discussion, and attend relevant training. The manager may commit to removing unnecessary assignments, clarifying decision-making authority, and holding a short weekly check-in.

    Measure progress through observable indicators such as work quality, deadlines, participation, attendance, collaboration, and completion of agreed actions. Avoid measuring personality traits such as enthusiasm or positivity.

    Support Career Growth and Visible Progress

    Employees commonly lose motivation when they cannot see a future in their role. Career development does not always require an immediate promotion. Cross-training, mentoring, project ownership, job rotation, skill development, and stretch assignments can restore momentum.

    Ask employees what they want to learn and which responsibilities interest them. Then connect development opportunities to both personal goals and operational needs. Small, visible achievements can rebuild confidence faster than distant promises about advancement.

    Frequently Asked Questions

    1. What is the most effective way to motivate a disengaged employee?

    The strongest approach is to identify the reason for the behavioral change, agree on specific improvements, remove genuine barriers, and follow up consistently.

    2. How do managers learn how to motivate disengaged employees?

    Managers should combine private conversations, active listening, clear expectations, appropriate autonomy, meaningful recognition, development opportunities, and measurable follow-up.

    3. Can a disengaged employee become engaged again?

    Yes. Re-engagement is more likely when the underlying issue is addressed early and both the manager and employee are willing to make specific changes.

    4. How long should a re-engagement plan last?

    A 30-day plan provides enough time to observe initial progress. More complex workload, training, or relationship issues may require 60 or 90 days.

    Moving Forward

    I believe the biggest mistake managers make is trying to create motivation before understanding why it disappeared. Employees rarely reconnect because they are pressured to appear more enthusiastic. 

    They reconnect when leaders listen, correct legitimate problems, clarify expectations, provide meaningful responsibility, and notice progress. When those actions are combined with fair accountability, managers can determine whether the employee needs support, a redesigned role, additional training, or a formal performance process.

  • AI Employee Scheduling Tools for Modern Businesses: Key Benefits

    AI Employee Scheduling Tools for Modern Businesses: Key Benefits

    I’ve watched employee scheduling turn into one of those jobs that looks simple until the details pile up. Someone is unavailable, another person has overtime approaching, demand changes, and suddenly a manager is moving names around a spreadsheet for hours. That process can work for a small team, but it becomes harder to manage as staffing needs grow.

    I’ve also noticed how quickly expectations around scheduling have changed. Employees want clearer schedules, easier shift changes, and more control over their availability, while managers need reliable coverage without wasting labor hours. That is where AI employee scheduling tools for modern businesses can make a practical difference, especially when scheduling decisions depend on more than a simple weekly template.

    What AI Employee Scheduling Tools Actually Do

    Traditional scheduling software can automate calendars, but AI-powered tools go further by analyzing patterns and making recommendations. They can consider employee availability, skills, certifications, labor rules, previous staffing levels, and expected demand at the same time.

    For a retailer, that might mean preparing more coverage around a busy weekend. For a restaurant, it could mean adjusting staffing around expected dinner traffic. The goal is not simply to fill every shift. It is to build a schedule that matches available people with the work the business expects to have.

    For businesses with hourly teams, that speed can become especially valuable during periods of changing demand. A schedule may need to shift because of weather, a local event, a promotion, a seasonal rush, or an unexpected absence. Instead of treating the published roster as fixed, managers can use updated information to make targeted changes while preserving coverage. This makes scheduling more responsive without requiring someone to manually recalculate every employee’s hours whenever conditions change. That can reduce disruption for both managers and frontline employees during busy operating periods.

    Lower Labor Costs Without Guesswork

    Lower Labor Costs Without Guesswork

    One of the clearest benefits is better control over labor spending. Overstaffing means paying for hours that may not be needed, while understaffing can create service problems, employee stress, and missed sales opportunities.

    AI scheduling software can use historical sales, seasonal patterns, foot traffic, and other business data to estimate staffing requirements. Managers can then build schedules around anticipated demand rather than relying entirely on instinct.

    Overtime is another area where automation can help. A scheduling system can identify when assigning a particular shift would push an employee toward overtime and suggest another qualified person instead. That does not eliminate the need for managerial judgment, but it gives managers a useful warning before a costly mistake reaches the published schedule.

    Claims about specific savings vary by business and implementation, so the value should be measured against a company’s own labor data rather than assumed from a generic percentage.

    Give Managers More Time for Actual Management

    Scheduling can consume a surprising amount of a manager’s working day. Finding replacements, checking availability, reviewing time-off requests, and resolving conflicts are necessary tasks, but they do not always require a manager to make every decision manually.

    AI employee scheduling tools can automate much of that administrative work. When someone calls out, the system can identify available workers and filter potential replacements according to relevant qualifications and scheduling rules.

    That can be particularly useful in industries where staffing changes happen frequently. Instead of sending a string of texts and waiting for replies, a manager can start with a list of suitable options and make the final call.

    Make Compliance Easier to Manage

    Scheduling mistakes are not always just inconvenient. Depending on the workplace and jurisdiction, businesses may need to account for overtime rules, required breaks, rest periods, minor labor restrictions, union agreements, or other scheduling requirements.

    Modern workforce scheduling tools can incorporate configured rules into the scheduling process and flag potential conflicts. A system might identify an employee who is approaching a weekly hour limit or highlight a sequence of shifts that creates an insufficient rest period.

    Businesses still need accurate rules, current configurations, and appropriate human oversight. However, automated checks can reduce the chance that a manager overlooks an issue while working under pressure.

    Improve the Employee Scheduling Experience

    Improve the Employee Scheduling Experience

    Scheduling affects employees just as directly as it affects managers. A schedule that changes constantly or provides little visibility can make it harder for workers to plan transportation, family responsibilities, appointments, and personal time.

    AI-powered scheduling platforms can give employees greater access to their schedules and availability tools. Depending on the system, workers may be able to submit time-off requests, update availability, view upcoming shifts, or swap shifts with qualified coworkers.

    Flexibility should not mean unpredictability. A useful system should help businesses maintain coverage while giving employees clearer information about when they are expected to work.

    AI can also help managers distribute shifts more consistently by applying the same scheduling rules across the workforce. That can reduce some of the inconsistency that occurs when every scheduling decision is made manually, although managers should still review recommendations and account for circumstances the software cannot understand.

    Use AI Scheduling Without Losing Human Judgment

    AI works best as a decision-support tool, not as a replacement for responsible management. Its recommendations depend on the information it receives. If employee availability is outdated, skills are recorded incorrectly, or demand data is incomplete, the resulting schedule can still be wrong.

    Businesses should therefore look for tools that integrate with systems they already use, provide clear controls, support employee self-service, and allow managers to review or adjust recommendations.

    A scheduling process that works for one location may become difficult across several stores, departments, or sites. The right platform should make complexity easier to manage rather than simply adding another layer of software.

    FAQs: AI Employee Scheduling Tools for Modern Businesses: Key Benefits

    1. What are AI employee scheduling tools?

    They are software platforms that use automation, data analysis, and sometimes machine learning to help businesses create and adjust employee schedules based on factors such as demand, availability, skills, and labor rules.

    2. Can AI scheduling reduce labor costs?

    It can help by matching staffing levels more closely with expected demand and identifying potential overtime. Actual savings depend on the business, workforce, data quality, and how the system is implemented.

    3. Do employees benefit from AI scheduling?

    They can. Features such as schedule visibility, availability updates, time-off requests, and shift swaps can give employees more control and make scheduling easier to manage.

    4. Should managers let AI create schedules without reviewing them?

    No. Human review remains valuable because managers understand circumstances that scheduling software may not capture, including team dynamics, unusual customer needs, and changing business priorities.

    Why Better Scheduling Starts With Better Decisions

    The biggest advantage of AI scheduling is not that a computer can produce a roster faster. It is that businesses can make staffing decisions using more information, fewer manual steps, and a clearer view of operational demand. When the technology is connected to reliable data and sensible rules, it can help managers respond to change without constantly starting the scheduling process from scratch.

    Good scheduling will always involve people. AI simply gives those people better tools for handling the complexity behind every shift.

  • Workforce Management Tools for Accurate Payroll Data: What to Look For

    Workforce Management Tools for Accurate Payroll Data: What to Look For

    I’ve learned that payroll problems rarely begin when someone runs payroll. They usually start earlier, when an employee’s hours are entered incorrectly, a schedule changes without being reflected elsewhere, or a manager has to reconcile several records by hand. Those small gaps can turn into bigger headaches at payday.

    I’ve also noticed how much easier payroll review becomes when scheduling, timekeeping, and employee records stay connected. Instead of chasing missing punches or comparing spreadsheets, managers can review one flow of workforce data and fix issues before they reach payroll. That is the real value worth looking for in workforce management tools for accurate payroll data.

    Why Payroll Accuracy Starts Before Payroll

    Payroll cannot correct inaccurate source data. Errors can begin with a missed punch, incorrect overtime, an unrecorded break, or a schedule change that never reaches the timesheet.

    That is why workforce management should be viewed as a connected process rather than a collection of separate features. Scheduling establishes expectations, time tracking records actual hours, managers review exceptions, and payroll uses approved information.

    The strongest systems reduce the number of times that information has to be copied or re-entered. Fewer handoffs mean fewer opportunities for entry errors and mismatched records.

    What to Look For in Workforce Management Tools

    What to Look For in Workforce Management Tools

    Connected Scheduling and Time Tracking

    For businesses still relying heavily on spreadsheets, modern alternatives to spreadsheet employee scheduling can create a more reliable workflow by keeping schedules, availability, changes, and actual hours in the same environment.

    Accurate Time and Attendance Capture

    Look for flexible ways to capture working time without creating another administrative task. Depending on the workplace, that might include desktop clock-ins, mobile time tracking, kiosks, geofencing, or other verification methods.

    Biometric options can help organizations limit buddy punching, while geofencing can confirm that mobile clock-ins happen within approved locations. The broader principle matters: time should be captured as close to the actual work event as possible.

    The system should make missing punches and unusual hours easy to spot.

    Payroll Integration That Reduces Re-Entry

    A workforce platform should fit into the payroll environment a business already uses. Direct integrations can transfer approved hours without requiring downloads, edits, and reuploads.

    That matters because manual transfers create another point where information can change accidentally.

    When comparing systems, ask what information actually moves between platforms, how often synchronization occurs, and what happens when a record does not match. A connection that exists technically but still requires substantial manual cleanup may not deliver the efficiency a buyer expects. That makes the review process faster, clearer, and less dependent on corrections during every pay cycle.

    Compliance Features That Support Payroll

    Payroll accuracy is also connected to wage-and-hour compliance. Rules around overtime, breaks, pay rates, and working time can become complicated, particularly for employers operating across locations.

    Useful workforce management software can apply configured pay rules, flag overtime, and identify potential break issues before payroll is finalized.

    Software should not replace legal guidance, but it can apply configured rules consistently and surface exceptions.

    Reporting, Alerts, and Audit Trails

    Reporting, Alerts, and Audit Trails

    Good reporting should answer practical questions, not simply produce attractive charts. Managers may need to know which employees have missing punches, where scheduled hours differ significantly from actual hours, or which timesheets remain unapproved.

    Alerts can surface exceptions before payroll closes, when corrections are easier than fixing an issued paycheck.

    Audit trails are useful for another reason. When a timesheet changes, a record of what was changed and when can help managers understand the history behind the final number. This creates greater accountability and makes payroll questions easier to investigate.

    Employee Self-Service Can Improve Data Quality

    Employees are often the people best positioned to notice an incorrect time entry. Giving them access to schedules, timesheets, leave information, and correction requests can move some of that review closer to the source.

    For businesses comparing time tracking tools connected to employee schedules, this is an important consideration. A connected employee experience can make it easier to see what was planned, what was recorded, and what needs correction.

    Look Beyond the Feature List

    Two workforce management platforms can offer similar features while creating very different experiences. Pay attention to implementation, usability, integration quality, reporting, permissions, mobile access, and support.

    Consider how the system will handle growth as locations, shifts, pay rules, or scheduling complexity increase.

    Why Better Data Flow Matters

    The most useful workforce management tools do more than automate isolated tasks. They create a cleaner path from the schedule an employee receives to the hours they actually work, and the information ultimately used for payroll.

    This connection can reduce administration, surface discrepancies, and clarify what happened during each pay period.

    The best choice depends on the workforce, existing payroll system, locations, compliance requirements, and daily operating habits.

    FAQs: Workforce Management Tools for Accurate Payroll Data: What to Look For

    1. How do workforce management tools improve payroll accuracy?

    They connect scheduling, time tracking, approvals, and payroll data, reducing manual entry and making discrepancies easier to identify before payroll is processed.

    2. Should workforce management software integrate with payroll?

    Yes. A direct integration can reduce duplicate data entry and help approved employee hours move more consistently into payroll processing.

    3. Can workforce management software help with compliance?

    It can support compliance by applying configured overtime and break rules, flagging exceptions, and maintaining records. Employers remain responsible for understanding applicable laws.

    4. What feature should businesses prioritize first?

    Start with accurate time capture and a reliable connection between timekeeping and payroll. Other features should support the specific needs of the workforce and existing systems.

    The Value of Getting the Workflow Right

    Payroll accuracy is ultimately a data-quality issue. When schedules, attendance records, approvals, and payroll systems communicate clearly, managers spend less time reconstructing what happened and more time resolving the exceptions that genuinely need attention. A well-chosen workforce platform can make that process feel routine instead of stressful, especially as teams become larger or schedules become more complex.

    Better payroll does not require more spreadsheets or more last-minute checking. It starts with cleaner workforce data, captured accurately and carried through each step with fewer chances for something to go wrong.

  • Operational Efficiency Audit Checklist for Retail Stores

    Operational Efficiency Audit Checklist for Retail Stores

    I spent fifteen years watching store managers run paper audits that changed nothing. They checked boxes, filed clipboards into filing cabinets, and watched shrinkage creep upward anyway. An operational efficiency audit checklist for retail stores must serve as an active diagnostic instrument, not an administrative chore. 

    If your current store audit does not uncover why your payroll leaks or why checkout queues stall, scrap it. Modern retail margins leave no room for vanity inspections.

    According to research by the National Retail Federation, inventory distortion and operational shrinkage continue to drain billions from brick-and-mortar balance sheets annually. Real store efficiency begins when your team diagnoses friction at the point of execution.

    Store Operational Health Model 

    Store Operational Health Model 

                             ┌────────────────────────────────┐

                              │   Store Operational Health     │

                              └───────────────┬────────────────┘

                                              │

              ┌────────────────┬──────────────┴───────────────┬────────────────┐

              │                │                              │                │

       [Merchandising]     [Labor]                       [Inventory]         [POS]

    • Planograms        • Traffic-to-labor match      • Cycle counts     • Queue time
    • Eye-level tags    • Cross-trained cashiers      • FIFO / RTV       • Hardware speed

    Storefront Visuals and Merchandising Execution

    Storefront Visuals and Merchandising Execution

    Your sales floor is either an engine of conversion or a maze of missed opportunities. Visual merchandising must do more than look pretty; it must funnel foot traffic directly toward high-velocity inventory.

    When conducting a floor audit, I inspect planogram compliance with a critical eye. Shelf misalignment creates phantom stockouts—inventory that exists in the system but remains invisible to the customer.

    Inspection Focus Standard Benchmark Friction Indicator
    Promotional Signage 100% current campaign alignment Expired sale tags still displayed on endcaps
    Eye-Level Stocking Top 20% velocity SKUs placed at 48″–60″ High-margin merchandise buried on bottom shelves
    Planogram Adherence ≥ 95% SKU position accuracy Arbitrary product substitutions made by floor staff
    Shelf Labeling Zero price mismatches against POS database Price discrepancy between shelf tag and terminal

    Audit digital and paper shelf tags against your point-of-sale pricing engine weekly. A single mismatched SKU damages customer trust and slows down terminal throughput during morning rushes.

    Labor Allocation and Shift Productivity

    Labor Allocation and Shift Productivity

    Labor represents your largest controllable operating expense. Overstaffing bleeds payroll margin, while understaffing burns out your top performers and spikes turnover rates.

    Evaluating scheduling data alongside foot traffic reveals clear operational patterns. To maintain stable floor coverage, store operators often need to reduce absenteeism in shift work operations before attempting to re-engineer their shift rosters. When employees consistently call out, cross-trained staff absorb the impact, creating cascading bottlenecks across cash wraps and stockrooms.

                          [Peak Foot Traffic Surge]

                                       │

                        ┌──────────────┴──────────────┐

                        ▼                             ▼

            [Dedicated Cashiers]            [Cross-Trained Associates]

            Handles base checkout line      Flexes to POS within 60 seconds

    Tying Labor Hours to Transaction Volume

    Audit your schedules against peak door-counter trends rather than sales totals. Transaction totals lag behind foot traffic; shoppers leave empty-handed when customer service is absent.

    Calculate your labor efficiency by measuring the cost of employee turnover in hourly jobs formula across quarters. Stores that operate with structured, clear audit routines retain their floor staff significantly longer because expectations remain consistent and measurable.

    Inventory Accuracy, Receiving, and Backroom Flow

    A disorganized backroom reflects poor operational discipline throughout the store. If receiving takes twenty-four hours to log a pallet into your enterprise resource planning system, your inventory counts remain inaccurate for that entire operational window.

    I evaluate dock doors and processing areas on dock-to-stock velocity. Pallets sitting idle on a loading dock invite damage, theft, and inventory loss.

    Inventory Control Standard Benchmark Audit Method
    Cycle Counting ≥ 98% record accuracy across top SKUs Daily rolling counts of high-shrink categories
    Dock-to-Stock Speed Inbound shipments receipted in < 4 hours Timestamp verification from bill of lading to scan
    RTV (Return to Vendor) Damaged goods processed within 7 days Physical audit of dedicated quarantine shelving
    FIFO Rotation Zero expired or aged batches on active display Date-code inspection on rotating shelf displays

    Enforce strict First-In, First-Out (FIFO) procedures across all dated categories. Damaged goods must move to a secured Return to Vendor (RTV) area immediately rather than cluttering operational staging lanes.

    Checkout Throughput and POS Reliability

    The checkout area forms the final impression a shopper carries out the door. Long lines wipe out visual merchandising gains made on the sales floor.

    Harvard Business Review has highlighted that perceived checkout friction directly influences customer churn and lifetime value. Modern retail requires sub-three-minute queue times during baseline traffic.

    [Arrival at POS] ───► [Card / Tap Scan] ───► [Bagging & Receipt] ───► Target: < 180s

                                                                          Queue Time

    Audit your point-of-sale performance using these core checkpoints:

    1. Hardware Health: Test barcode scanners, receipt printers, and PIN pads daily before opening doors to eliminate transaction lag.
    2. Till Balancing: Enforce balanced drawer handovers with cash discrepancies kept strictly below three dollars per shift.
    3. Refund Friction: Keep returns under ninety seconds by equipping floor supervisors with mobile override credentials.

    Facility Safety, Compliance, and Shrink Defense

    Safety failures disrupt revenue faster than inventory mistakes. Non-compliance with standard workplace guidelines established by OSHA leads to costly citations and worker compensation claims that destroy store profitability.

    Loss prevention must be integrated into daily routines rather than treated as a separate security concern. Audit your cameras for blind spots caused by seasonal banners or shifted gondolas.

    Keep emergency egress routes, fire extinguishers, and electrical breaker panels clear of freight at all times. Verify that energy-management systems regulate heating, cooling, and display lighting automatically to prevent utility waste during non-operational hours.

    The Root-Cause Scoring Framework (Audit Benchmark)

    Standard pass/fail audits fail because they identify symptoms while ignoring underlying problems. When an operational item fails an inspection, categorize the issue using this root-cause scoring framework.

    Using productivity metrics every operations manager should track can help managers quantify the impact of these operational weaknesses and prioritize corrective action.

    Finding Category Diagnostic Definition Corrective Mandate
    Process Failure Standard operating procedure is outdated or missing Revise operational policy within 48 hours
    Training Deficit Associate unaware of correct operational execution Mandatory peer retraining within 5 operational days
    Systemic / Tool Breakdown Defective equipment, network lag, or broken software Escalate support ticket; bypass workflow temporarily

    Assign an operational score out of 100 for each department. Stores scoring below 85 require an operational re-audit within fourteen business days.

    Stop Auditing Like It’s 1999: Your Next Operational Move

    Clipboards belong in retail museums. If your team still conducts operational audits on paper sheets, transition to mobile audit software that logs photo evidence and assigns remediation tasks in real time.

    Pick two low-scoring areas from this checklist and run a baseline evaluation tomorrow morning before unlocking your doors. Give your store leaders the tools to locate friction, resolve it, and convert wasted labor hours into profitable floor execution.

    Frequently Asked Questions

    1. How often should a retail store conduct an operational efficiency audit?

    Run safety and POS checks daily, review stockrooms and merchandising weekly, and complete a full multi-point audit once a month.

    2. What is the most critical metric in a retail operational audit?

    Inventory record accuracy is paramount because corrupted stock data skews purchasing, fulfillment, and customer satisfaction simultaneously.

    3. How does an operational audit reduce store shrinkage?

    Audits identify CCTV blind spots, enforce disciplined receiving scans, and uncover phantom inventory before theft compounds.

    4. Can small independent retailers use this audit structure effectively?

    Yes, simply adapt the checkpoints to your footprint and focus primarily on POS reliability, shelf pricing, and backroom inventory counts.