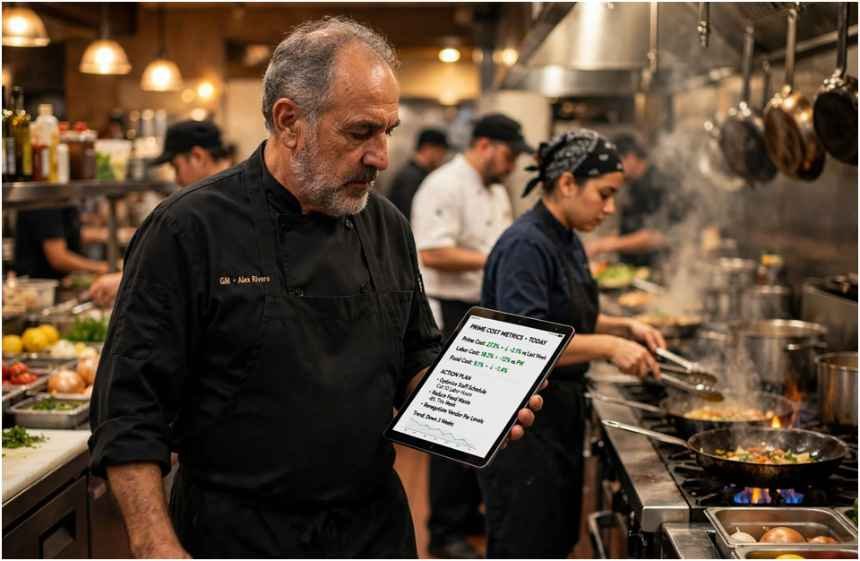
Most restaurant owners panic during margin squeezes and cut napkins, buy cheaper trash bags, or demand staff turn off prep lights. I ran kitchens for fifteen years, and I watched operators bleed money while worrying about pennies. Real financial discipline lives in Prime Cost—the combined sum of your Cost of Goods Sold (COGS) and labor expenses.
If you want effective strategies to lower operating costs in restaurant business environments, you must control this single combined metric. Prime Cost eats 55% to 65% of your total revenue. Pull those numbers down by even three percentage points, and you double your bottom line overnight.
Tame Prime Cost Before Touching Minor Expenses
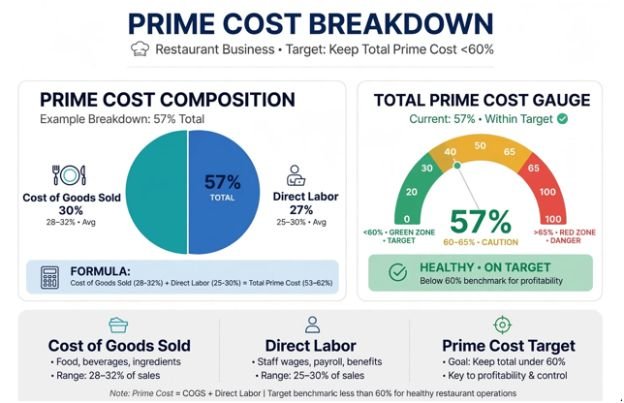
When food and labor drift beyond 60% of total sales, minor operational cuts cannot save your margins. I treat Prime Cost as an operational dashboard that exposes theft, over-portioning, and shift scheduling friction before they show up on an accountant’s end-of-month autopsy.
| Operational Lever | Target Baseline | High-Risk Threshold | Corrective Focus |
| Cost of Goods Sold (COGS) | 28% – 32% | > 35% | Inventory cycle counts, recipe spec sheets |
| Direct Floor & Kitchen Labor | 25% – 30% | > 33% | SPLH schedule cuts, cross-station training |
| Total Prime Cost Target | < 60% | > 65% | Immediate vendor and menu engineering review |
According to benchmark research from the National Restaurant Association, restaurants operating with Prime Costs above 66% rarely sustain positive operating cash flow during seasonal dips.
Pinpoint Leaks with Theoretical vs. Actual Food Cost
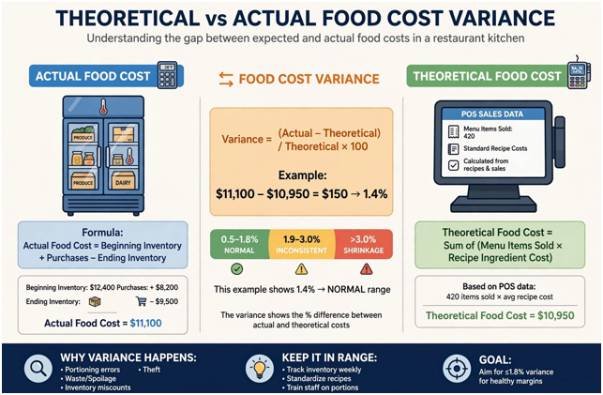
Standard inventory arithmetic tells you what you spent:
$$\text{Actual Food Cost} = \text{Beginning Inventory} + \text{Purchases} – \text{Ending Inventory}$$
It fails to reveal what you should have spent. To catch operational waste, calculate your Theoretical Food Cost by multiplying individual recipe costs by total units sold in your POS.
The gap between these two figures is your Food Cost Variance:
$$\text{Food Cost Variance} = \text{Actual Food Cost} – \text{Theoretical Food Cost}$$
In my kitchens, an operational variance between 1.0% and 1.8% represents standard trimming and moisture evaporation.
Once that variance clears 2.5%, raw ingredients are leaving the walk-in through over-portioning, unlogged prep spoilage, or outright theft.
| Variance Level | Operational Diagnosis | Floor Solution |
| 0.5% – 1.8% | Normal kitchen trim & cooking loss | Maintain standard line pars |
| 1.9% – 3.0% | Inconsistent scoops, unmeasured pours | Re-calibrate line scales and portion scoops |
| > 3.0% | Unrecorded prep loss or inventory shrinkage | Lock walk-ins; run twice-weekly spot audits |
Lock Down Yields and Standardized Portioning
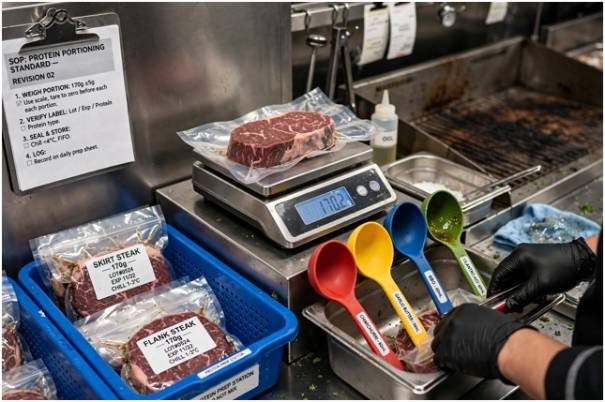
Line cooks often over-serve out of habit during a heavy service rush. An extra two ounces of skirt steak on a high-volume entree will quietly destroy margin percentages over a calendar quarter.
Eliminate guesswork on the line with our documented standard operating procedures template. Install dedicated digital scales at your grill stations, mandate color-coded portion ladles for sauces, and require pre-portioned bags for bulk proteins.
Eliminate Roster Bleed with Smarter Scheduling
Labor expense is volatile because managers frequently schedule around personal habit rather than actual customer covers. The U.S. Bureau of Labor Statistics shows sustained wage growth across the service sector, meaning unplanned overtime directly devours your net profit.
Schedule Shifts Against Sales Per Labor Hour (SPLH)
Ditch static shift schedules. Track Sales Per Labor Hour (SPLH) in real time:
$$\text{SPLH} = \frac{\text{Gross Hourly Sales}}{\text{Total Labor Hours Worked}}$$
If your target SPLH for Tuesday lunch is $85 and floor receipts show $55 at 1:45 PM, shift managers must immediately cut prep runners and early dish shifts.
Stagger employee in-times across 15-minute intervals rather than bringing entire teams in at the top of the hour.
| Daypart Window | Target SPLH Metric | Common Operational Bleed | Actionable Fix |
| Lunch Rush (11:30–1:30) | $90 – $110 | Early prep idle time | Stagger cook arrivals in 15-min intervals |
| Afternoon Slump (2:00–4:30) | $50 – $65 | Floor staff waiting for tables | Cut floor runners early; send preppers home |
| Dinner Rush (5:30–9:00) | $100 – $130 | Unscheduled overtime spikes | Cap pre-closing duties with strict shift caps |
Build Multi-Station Agility Across Shifts
Specialized roles inflate your headcount. If your expediter cannot jump on the fry line, or your hosts cannot bus glassware during sudden rushes, you run an overstaffed floor.
I use a structured cross training employees benefit matrix to track competencies across every station. Cross-training transforms front-of-house servers into back-of-house asset support during unexpected rushes, cutting overtime costs without sacrificing service speed.
Re-engineer Menus Around High-Margin Overlaps
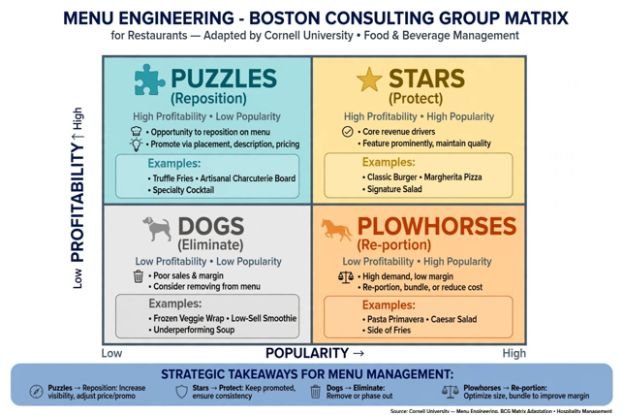
Menu engineering is not graphic design; it is inventory control. Review your sales mix against ingredient carrying costs every quarter using the classic Boston Consulting Group matrix adapted by the Cornell Center for Hospitality Research:
- Stars: High margin, high volume. Protect these recipes and standardize their production.
- Plowhorses: Low margin, high volume. Re-cost these immediately by introducing smart fillers or adjusting protein portions.
- Puzzles: High margin, low volume. Reposition them visually on your physical menu and train servers to highlight them.
- Dogs: Low margin, low volume. Eliminate them immediately.
HIGH PROFITABILITY
│
Puzzles │ Stars
(Reposition) │ (Protect)
──────────────┼────────────── HIGH POPULARITY
Dogs │ Plowhorses
(Eliminate) │ (Re-portion)
│
LOW PROFITABILITY
Cross-utilize high-cost proteins across multiple entrees. If your prime ribeye only appears in one single specialty dish, any dip in guest orders results in expensive spoilage.
Trim Overhead and Utility Baselines
Kitchen equipment consumes massive amounts of energy under constant heat loads. Equipment data compiled by ENERGY STAR Commercial Food Service indicates regular maintenance cuts equipment energy consumption by up to 15%.
| Facility Area | Maintenance Procedure | Operating Cost Impact |
| Refrigeration Units | Clean condenser coils monthly | Lowers compressor load and run-time power draw |
| Walk-in Freezers | Replace worn door gaskets and air strips | Prevents cold-air loss and emergency service calls |
| Dish Pit Operations | Run cycles solely on full racks | Drops hot water usage and chemical detergent spend |
Clean refrigerator coils every thirty days, change air filters on rooftop HVAC units quarterly, and fit low-flow pre-rinse spray valves in the dish pit. These operational adjustments deliver reliable savings without altering the guest experience.
Frequently Asked Questions
1. What is the fastest strategy to lower restaurant operating costs?
Audit your weekly protein portions and immediately cut mid-afternoon staff shifts based on hourly sales volume.
2. What should a healthy restaurant Prime Cost percentage be?
Aim to keep total Prime Cost (food, beverage, and total labor) strictly between 55% and 60% of total revenue.
3. How does food cost variance help manage inventory?
It reveals the gap between what you spent and what your sales mix required, exposing internal waste, over-portioning, and theft.
4. Can utility maintenance meaningfully lower restaurant overhead?
Yes, routine coil cleaning, gasket replacements, and low-flow dish valves lower kitchen utility expenses by 10% to 15%.
Drop the Pencils and Walk the Floor
Spreadsheets show you where money went yesterday, but operational savings happen on the floor right now.
Pull your POS product mix, compare theoretical usage against physical walk-in counts, and give line cooks the portioning tools they need to succeed.
Real margin recovery begins the moment you treat every ounce of inventory as cash sitting on your shelves.
Leave a Reply