
A productivity dashboard can look precise while measuring the wrong thing. An employee may log eight active hours and still finish little meaningful work. Useful workforce productivity tracking methods therefore begin with one question: what valuable result is this role supposed to produce?
The U.S. Bureau of Labor Statistics productivity program measures labor productivity as output relative to hours worked. In the second quarter of 2026, U.S. nonfarm business labor productivity rose 1.4% as output increased 1.7% and hours worked rose 0.3%. Productivity is ultimately about the relationship between effort and results.
Start With Output, Not Visible Activity
Tracking should begin with the unit of value a team creates: resolved support cases, qualified pipeline, revenue, or completed orders with low error rates. KPIs and OKRs work because they judge whether work advances business goals without assuming visible activity equals contribution.
A practical formula is:
Productivity rate = useful output ÷ labor input
Labor input may be hours, shifts, full-time equivalents, or labor cost. “Useful output” must fit the job. Measuring developers only by tickets closed may reward small tasks while undervaluing difficult debugging.
Five Workforce Productivity Tracking Methods Worth Using
1. Outcome and Goal Completion
Measure completed goals, revenue, cases resolved, units produced, projects shipped, or milestones reached.
In hospitality, these measures can also help teams assess how to manage seasonal demand fluctuations in hospitality by comparing staffing levels and service output across changing demand periods.
This works well for knowledge work because it focuses on results rather than digital presence. Use it when employees have clear deliverables and reasonable control over results.
2. Time and Task Tracking
Time tracking shows where labor is going in project-based work. Its best use is diagnostic: if a team spends 30% of its week on low-value administration, that is a process problem. Recorded time alone does not prove useful output.
Time data becomes especially valuable when managers compare it with project completion, labor cost, or customer outcomes rather than judging hours in isolation.
3. Quality-Adjusted Output

Volume without quality invites shortcuts. Pair throughput with error rates, rework, returns, first-contact resolution, defect rates, customer satisfaction, or audit accuracy.
A team processing more orders while producing many more errors may not be more productive. Quality-adjusted measures expose that trade-off.
4. Focus Time and Workflow Friction
Calendar and collaboration data can reveal meeting overload, task switching, and too little uninterrupted work time. Use this mainly at team level to find process problems, not punish short inactive periods.
Long approval chains, repeated handoffs, and unnecessary meetings may explain declining output more accurately than an individual employee’s activity level.
5. Application and Process Analytics
Software and process data can show which tools employees rely on and where work stalls.
Managers can also review productivity metrics every operations manager should track to identify meaningful workflow patterns without relying too heavily on individual activity levels.
The signal weakens when apps are labeled “productive” or “unproductive.” A browser may contain research, customer work, training, or distraction.
| Method | Best signal | Useful for | Main risk |
| Outcome tracking | Goals and results | Knowledge work, sales | Ignoring outside factors |
| Time/task tracking | Labor allocation | Billing and capacity | Confusing time with value |
| Quality metrics | Accuracy and impact | Service and operations | Overweighting one score |
| Focus analysis | Workflow friction | Office and hybrid teams | Micromanagement |
| App/process analytics | Workflow patterns | Digital work | Surveillance |
Build a Balanced Productivity Scorecard
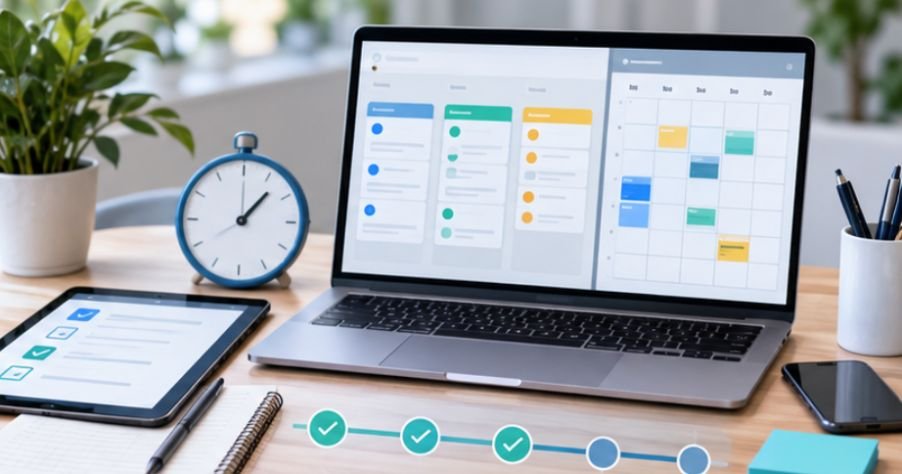
A single metric is easy to game. A stronger system combines output, quality, and sustainability. A support team could weight cases resolved at 50%, customer satisfaction and reopen rates at 30%, and backlog reduction at 20%. The exact weights should reflect business priorities rather than what software happens to measure easily.
Before adopting a metric, use this five-question test:
- Does it measure something the employee can reasonably influence?
- Could someone improve the number while making the real outcome worse?
- Does it capture quality as well as speed?
- Do employees know what is measured and how it is used?
- Would the metric still seem fair in a promotion or performance review?
Any “no” is a reason to redesign the measure before attaching consequences to it.
Why Surveillance Can Distort Productivity Data
Digital monitoring can collect keystrokes, screenshots, location, application use, audio, video, and other behavioral data. These tools can create operational insight, but also a false sense of precision.
A 2025 U.S. Government Accountability Office review of digital workplace surveillance drew on 122 studies plus stakeholder interviews. GAO found that digital surveillance may help operations in some situations, but flawed benchmarks can miss parts of a worker’s responsibilities.
Overtime productivity decline studies provide another example of why hours worked should be evaluated alongside actual output, quality, and fatigue rather than treated as a direct measure of productivity.
The reviewed evidence also identified possible effects including stress, anxiety, and inaccurate performance evaluations.
The American Psychological Association’s research on electronic monitoring reported that 51% of workers in its 2023 Work in America survey were aware their employer monitored them electronically. Among monitored workers, 56% said they typically felt tense or stressed at work.
Collect data for a legitimate purpose, and avoid turning behavioral proxies into automatic judgments.
Make Tracking Fair, Transparent, and Job-Specific

The U.S. Equal Employment Opportunity Commission’s workplace guidance gives a useful example: a worker with a visual disability who uses voice recognition software could be unfairly scored by an algorithm that treats keystrokes as productivity. The EEOC notes that alternative measures may be necessary to assess actual performance accurately.
Metrics must be valid for the way a job can actually be performed.
Employers should document each metric, its purpose, data source, review frequency, and owner. Employees should know whether data is used for coaching, capacity planning, pay, promotion, safety, or discipline.
The NIOSH guidance on fatigue and work notes that fatigue can reduce attention, short-term memory, reaction time, and judgment. If a productivity target encourages skipped breaks, chronic overtime, or an unsafe pace, the measurement system may undermine the performance it is supposed to improve.
What Not to Measure Too Literally
Keyboard activity, green-status time, emails sent, meetings attended, and hours online are easy to count. For many roles, they are weak performance measures.
They may help diagnose workflow issues, but they should rarely stand alone in evaluations. The closer a measure gets to compensation, discipline, or promotion, the more directly it should connect to job outcomes.
The best workforce productivity tracking methods use activity data as context, not as the verdict.
Frequently Asked Questions
1. What is the best way to track workforce productivity?
Use a balanced set of outcome, quality, and labor-input measures. Match the mix to the role and avoid relying on a single activity metric.
2. Should employers track employee computer activity?
Only for a clear business purpose. Workflow data can reveal bottlenecks, but constant individual surveillance can create privacy, trust, and accuracy problems.
3. How often should productivity metrics be reviewed?
Operational metrics may be checked weekly, while strategic trends often make more sense monthly or quarterly. Match the cadence to how quickly meaningful performance can change.
4. What metrics work well for remote employees?
Use deliverables, milestones, quality, customer outcomes, response standards, and team commitments. Avoid defining productivity mainly through online status or keyboard activity.
A Better Way to Think About Productivity
The most important number on a productivity dashboard is not always the easiest one to collect. Strong measurement starts with valuable output, checks its quality, and asks what labor and work conditions were required to produce it.
That gives managers more than a record of who looked busy. It reveals where capacity is constrained, where processes fail, and where teams create real value. If a metric cannot improve a decision, remove a bottleneck, or clarify performance, it probably does not deserve a place on the dashboard.
Leave a Reply